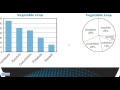
Understanding Circle and Bar Graphs
Interactive Video
•
Mathematics, Education
•
4th - 6th Grade
•
Practice Problem
•
Medium

Sophia Harris
Used 5+ times
FREE Resource
Read more
10 questions
Show all answers
1.
MULTIPLE CHOICE QUESTION
30 sec • 1 pt
What are the two types of graphs introduced in the video?
Bar graphs and circle graphs
Line graphs and bar graphs
Pie charts and line graphs
Histograms and pie charts
2.
MULTIPLE CHOICE QUESTION
30 sec • 1 pt
In a bar graph, what is typically represented on the x-axis?
Values
Categories
Percentages
Titles
3.
MULTIPLE CHOICE QUESTION
30 sec • 1 pt
What is the y-axis used for in a bar graph?
Categories
Values
Percentages
Titles
4.
MULTIPLE CHOICE QUESTION
30 sec • 1 pt
What is another name for a circle graph?
Pie chart
Bar graph
Line graph
Histogram
5.
MULTIPLE CHOICE QUESTION
30 sec • 1 pt
What key information is displayed in the sections of a circle graph?
Titles
Values
Categories
Percentages
6.
MULTIPLE CHOICE QUESTION
30 sec • 1 pt
Which of the following is a similarity between bar graphs and circle graphs?
Both use percentages
Both have categories and titles
Both are circular
Both use bushels
7.
MULTIPLE CHOICE QUESTION
30 sec • 1 pt
How does a bar graph represent data compared to a circle graph?
Using lines
Using sections
Using bars
Using percentages
Access all questions and much more by creating a free account
Create resources
Host any resource
Get auto-graded reports
Continue with Google

Continue with Email
Continue with Classlink
Continue with Clever
or continue with
Microsoft
%20(1).png)
Apple
Others
Already have an account?
