Understanding Graphs and Surveys
Interactive Video
•
Mathematics
•
3rd - 4th Grade
•
Practice Problem
•
Hard

Sophia Harris
FREE Resource
Read more
5 questions
Show all answers
1.
MULTIPLE CHOICE QUESTION
30 sec • 1 pt
What is the first step JT takes to understand his class's favorite colors?
He asks his teacher.
He surveys his class.
He draws a bar graph.
He uses a picture graph.
2.
MULTIPLE CHOICE QUESTION
30 sec • 1 pt
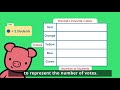
In JT's picture graph, what does one circle represent?
One vote
Four votes
Three votes
Two votes
3.
MULTIPLE CHOICE QUESTION
30 sec • 1 pt
How does JT represent one person liking green in his picture graph?
With a full circle
With a square
With half a circle
With a triangle
4.
MULTIPLE CHOICE QUESTION
30 sec • 1 pt
What is a key feature of the bar graph JT creates?
It has numbers set apart evenly on the side.
It goes from side to side.
It uses different colors for each bar.
It uses circles to represent votes.
5.
MULTIPLE CHOICE QUESTION
30 sec • 1 pt
How can you determine how many more people voted for blue than yellow in JT's bar graph?
By examining the empty space between the bars.
By looking at the labels.
By counting the circles.
By checking the title of the graph.
Access all questions and much more by creating a free account
Create resources
Host any resource
Get auto-graded reports
Continue with Google

Continue with Email
Continue with Classlink
Continue with Clever
or continue with
Microsoft
%20(1).png)
Apple
Others
Already have an account?
