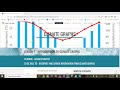
Interpreting Climate Graphs: Understanding Temperature and Precipitation Data
Interactive Video
•
Geography, Science, Mathematics
•
5th - 6th Grade
•
Practice Problem
•
Hard

Patricia Brown
FREE Resource
Read more
10 questions
Show all answers
1.
MULTIPLE CHOICE QUESTION
30 sec • 1 pt
What is the primary purpose of a climate graph?
To illustrate the economic development of a country
To display the average temperature and precipitation of a place
To map the geographical features of an area
To show the population growth of a region
2.
MULTIPLE CHOICE QUESTION
30 sec • 1 pt
How is temperature typically represented in a climate graph?
As a scatter plot
As a line graph
As a pie chart
As a bar graph
3.
MULTIPLE CHOICE QUESTION
30 sec • 1 pt
What color is commonly used to represent temperature in climate graphs?
Yellow
Red
Green
Blue
4.
MULTIPLE CHOICE QUESTION
30 sec • 1 pt
In climate graphs, what does the bar graph represent?
Wind speed
Precipitation
Humidity
Sunshine hours
5.
MULTIPLE CHOICE QUESTION
30 sec • 1 pt
What is the average rainfall in Grafton during June according to the example?
100 mm
80 mm
78 mm
60 mm
6.
MULTIPLE CHOICE QUESTION
30 sec • 1 pt
How can climate graphs help determine the hemisphere of a location?
By displaying seasonal temperature and rainfall patterns
By showing the population density
By indicating the type of vegetation
By mapping the geographical terrain
7.
MULTIPLE CHOICE QUESTION
30 sec • 1 pt
Which months are considered summer in the Southern Hemisphere?
June, July, August
December, January, February
March, April, May
September, October, November
Access all questions and much more by creating a free account
Create resources
Host any resource
Get auto-graded reports
Continue with Google

Continue with Email
Continue with Classlink
Continue with Clever
or continue with
Microsoft
%20(1).png)
Apple
Others
Already have an account?
