- Resource Library
- Math
- Probability And Statistics
- Center And Spread
- Understanding Shape, Center, Spread, And Graphs
Understanding Shape, Center, Spread, and Graphs
Interactive Video
•
Mathematics
•
6th - 8th Grade
•
Practice Problem
•
Medium
+1
Standards-aligned

Ethan Morris
Used 11+ times
FREE Resource
Standards-aligned
Read more
10 questions
Show all answers
1.
MULTIPLE CHOICE QUESTION
30 sec • 1 pt
Which of the following terms is used to describe the shape of a distribution?
Bimodal
Standard Deviation
Median
Mean
Tags
CCSS.6.SP.B.5C
2.
MULTIPLE CHOICE QUESTION
30 sec • 1 pt
What is the median weight of Ms. Crandall's five cats?
10.4 pounds
10 pounds
17 pounds
6 pounds
Tags
CCSS.6.SP.B.5C
3.
MULTIPLE CHOICE QUESTION
30 sec • 1 pt
How do you calculate the mean weight of a set of numbers?
Subtract the smallest number from the largest
Add all the numbers and divide by the total count
Multiply all the numbers together
Find the middle number in the ordered list
4.
MULTIPLE CHOICE QUESTION
30 sec • 1 pt
What does a standard deviation of 3.72 pounds indicate about the weights of Ms. Crandall's cats?
The mean weight is 3.72 pounds
On average, each weight is about 3.72 pounds away from the mean
Each weight is exactly 3.72 pounds
The weights are all within 3.72 pounds of each other
5.
MULTIPLE CHOICE QUESTION
30 sec • 1 pt
Which of the following distributions is approximately symmetric?
Set A
Set D
Set E
Set F
6.
MULTIPLE CHOICE QUESTION
30 sec • 1 pt
Which data set has a bigger mean based on the dot plots?
Set A
Set B
Both have the same mean
Cannot be determined
Tags
CCSS.6.SP.B.4
CCSS.HSS.ID.A.1
7.
MULTIPLE CHOICE QUESTION
30 sec • 1 pt
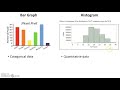
What is the main difference between a bar graph and a histogram?
Bar graphs can be reordered, histograms cannot
Bar graphs have gaps between bars, histograms do not
Histograms show discrete data, bar graphs show continuous data
Bar graphs show quantitative data, histograms show categorical data
Tags
CCSS.2.MD.D.10
Access all questions and much more by creating a free account
Create resources
Host any resource
Get auto-graded reports
Continue with Google

Continue with Email
Continue with Classlink
Continue with Clever
or continue with
Microsoft
%20(1).png)
Apple
Others
Already have an account?
