Understanding Line Plots and Rainfall Data
Interactive Video
•
Mathematics
•
4th - 5th Grade
•
Practice Problem
•
Hard

Nancy Jackson
FREE Resource
5 questions
Show all answers
1.
MULTIPLE CHOICE QUESTION
30 sec • 1 pt
What is the primary purpose of a line plot?
To show the relationship between two variables
To display data with many repeating values
To display data over time
To compare different categories
2.
MULTIPLE CHOICE QUESTION
30 sec • 1 pt
How many days did it rain 1/4 inch according to the line plot?
1 day
2 days
3 days
4 days
3.
MULTIPLE CHOICE QUESTION
30 sec • 1 pt
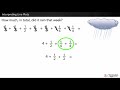
What is the total amount of rain that fell during the week?
7 inches
5 inches
4 inches
6 inches
4.
MULTIPLE CHOICE QUESTION
30 sec • 1 pt
What is the difference between the greatest and least amounts of rain recorded?
1 and 1/4 inches
3/4 inch
1 inch
1/2 inch
5.
MULTIPLE CHOICE QUESTION
30 sec • 1 pt
If it rained half as much the following week, how much rain fell?
1 inch
2 and 1/2 inches
3 inches
2 inches
Access all questions and much more by creating a free account
Create resources
Host any resource
Get auto-graded reports
Continue with Google

Continue with Email
Continue with Classlink
Continue with Clever
or continue with
Microsoft
%20(1).png)
Apple
Others
Already have an account?
