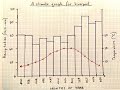
Creating and Interpreting Climate Graphs
Interactive Video
•
Geography
•
6th - 7th Grade
•
Hard

Thomas White
FREE Resource
Read more
11 questions
Show all answers
1.
MULTIPLE CHOICE QUESTION
30 sec • 1 pt
What is the first step in creating a climate graph?
Drawing the graph axes
Labeling the graph
Collecting climate data
Plotting the data
2.
MULTIPLE CHOICE QUESTION
30 sec • 1 pt
What materials are recommended for drawing a climate graph?
Graph paper, pen, and eraser
Graph paper, ruler, and pencil
Whiteboard, marker, and eraser
Notebook, ruler, and pen
3.
MULTIPLE CHOICE QUESTION
30 sec • 1 pt
How many squares are used to represent each month on the graph?
Five squares
Seven squares
Ten squares
Three squares
4.
MULTIPLE CHOICE QUESTION
30 sec • 1 pt
What should be labeled on the bottom axis of the climate graph?
Months of the year
Days of the week
Precipitation
Temperature
5.
MULTIPLE CHOICE QUESTION
30 sec • 1 pt
What is the maximum value for precipitation on the left-hand axis?
60 mm
80 mm
90 mm
100 mm
6.
MULTIPLE CHOICE QUESTION
30 sec • 1 pt
How is precipitation represented on the climate graph?
As a line
As bars
As a curve
As dots
7.
MULTIPLE CHOICE QUESTION
30 sec • 1 pt
What is the maximum temperature value on the right-hand axis?
10 degrees
20 degrees
30 degrees
40 degrees
Access all questions and much more by creating a free account
Create resources
Host any resource
Get auto-graded reports
Continue with Google

Continue with Email
Continue with Classlink
Continue with Clever
or continue with
Microsoft
%20(1).png)
Apple
Others
Already have an account?
