Class Boundaries and Histograms
Interactive Video
•
Mathematics
•
9th - 10th Grade
•
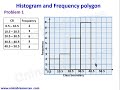
Practice Problem
•
Hard

Thomas White
FREE Resource
Read more
12 questions
Show all answers
1.
MULTIPLE CHOICE QUESTION
30 sec • 1 pt
What is the main focus of this tutorial?
Bar charts and pie charts
Histograms and frequency polygons
Line graphs and scatter plots
Box plots and dot plots
2.
MULTIPLE CHOICE QUESTION
30 sec • 1 pt
What is the first step in solving Problem 1?
Using the frequency table
Calculating class mid-values
Estimating the mode
Drawing the histogram
3.
MULTIPLE CHOICE QUESTION
30 sec • 1 pt
How do you calculate the lower class boundary for the first interval?
By multiplying 0 and 1
By dividing 1 by 0
By subtracting 1 from 0
By adding 0 and 1, then dividing by 2
4.
MULTIPLE CHOICE QUESTION
30 sec • 1 pt
What is the upper class boundary for the interval 11 to 20?
20.5
22.5
21.5
23.5
5.
MULTIPLE CHOICE QUESTION
30 sec • 1 pt
What is the height of the bar for the interval 30.5 to 40.5 in the histogram?
6
7
8
9
6.
MULTIPLE CHOICE QUESTION
30 sec • 1 pt
How is the mode estimated from the histogram?
By finding the shortest bar
By calculating the average of all bars
By summing all frequencies
By identifying the tallest bar
7.
MULTIPLE CHOICE QUESTION
30 sec • 1 pt
What is the first step in drawing a frequency polygon?
Calculating the range
Drawing vertical lines
Finding the midpoint of the bars
Calculating the mean of the data
Access all questions and much more by creating a free account
Create resources
Host any resource
Get auto-graded reports
Continue with Google

Continue with Email
Continue with Classlink
Continue with Clever
or continue with
Microsoft
%20(1).png)
Apple
Others
Already have an account?
