Profit and Arithmetic Calculations
Interactive Video
•
Mathematics
•
4th - 5th Grade
•
Practice Problem
•
Hard

Thomas White
FREE Resource
Read more
15 questions
Show all answers
1.
MULTIPLE CHOICE QUESTION
30 sec • 1 pt
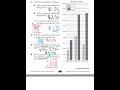
What does the light gray color represent in the candy sales graph?
Average sales
Game 2
Game 1
Total sales
2.
MULTIPLE CHOICE QUESTION
30 sec • 1 pt
How much profit was made from bubblegum during Game 1?
$1.00
$1.25
$1.50
$1.75
3.
MULTIPLE CHOICE QUESTION
30 sec • 1 pt
What was the profit for bubblegum during Game 2?
$3.50
$4.00
$3.00
$2.50
4.
MULTIPLE CHOICE QUESTION
30 sec • 1 pt
How much more profit was made on bubblegum during Game 2 than Game 1?
$1.00
$1.25
$1.50
$1.75
5.
MULTIPLE CHOICE QUESTION
30 sec • 1 pt
What was the profit for hard candy during Game 2?
$6.00
$4.00
$10.00
$8.00
6.
MULTIPLE CHOICE QUESTION
30 sec • 1 pt
How much more profit was made on hard candy during Game 2 than Game 1?
$3.75
$3.00
$4.00
$2.75
7.
MULTIPLE CHOICE QUESTION
30 sec • 1 pt
What was the profit for sour strings during Game 2?
$7.75
$8.00
$8.25
$8.50
Access all questions and much more by creating a free account
Create resources
Host any resource
Get auto-graded reports
Continue with Google

Continue with Email
Continue with Classlink
Continue with Clever
or continue with
Microsoft
%20(1).png)
Apple
Others
Already have an account?
