Understanding Histograms and Data Representation
Interactive Video
•
Mathematics
•
6th - 7th Grade
•
Practice Problem
•
Hard

Jackson Turner
FREE Resource
Read more
9 questions
Show all answers
1.
MULTIPLE CHOICE QUESTION
30 sec • 1 pt
What is the primary purpose of a histogram?
To list data in a table
To calculate averages
To represent data ranges with bars
To display individual data points
2.
MULTIPLE CHOICE QUESTION
30 sec • 1 pt
What is the range of the first bar in the histogram?
50 to 59
40 to 49
60 to 69
30 to 39
3.
MULTIPLE CHOICE QUESTION
30 sec • 1 pt
Why is it important to label your graphs?
To make them colorful
To ensure clarity and understanding
To add more data
To make them look professional
4.
MULTIPLE CHOICE QUESTION
30 sec • 1 pt
How many students fall in the 40 to 49 range?
5
8
12
15
5.
MULTIPLE CHOICE QUESTION
30 sec • 1 pt
How many students are in the 30 to 39 range?
5
7
3
1
6.
MULTIPLE CHOICE QUESTION
30 sec • 1 pt
What is the significance of bars touching in a histogram?
It is a traditional design
It separates different data sets
It makes the graph look better
It shows continuity of data
7.
MULTIPLE CHOICE QUESTION
30 sec • 1 pt
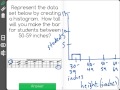
What is the height of the bar for students between 50 to 59 inches?
10
16
12
14
Access all questions and much more by creating a free account
Create resources
Host any resource
Get auto-graded reports
Continue with Google

Continue with Email
Continue with Classlink
Continue with Clever
or continue with
Microsoft
%20(1).png)
Apple
Others
Already have an account?
