Soda Consumption and Correlation Concepts
Interactive Video
•
Mathematics
•
6th - 7th Grade
•
Practice Problem
•
Hard

Patricia Brown
FREE Resource
Read more
10 questions
Show all answers
1.
MULTIPLE CHOICE QUESTION
30 sec • 1 pt
What is the purpose of using graphs in predictions?
To make data look more colorful
To predict possible solutions or answer questions
To confuse the audience
To avoid using numbers
2.
MULTIPLE CHOICE QUESTION
30 sec • 1 pt
What type of scatter plot shows no correlation?
Dots forming a curve
Dots forming a circle
Dots forming a straight line
Dots scattered randomly
3.
MULTIPLE CHOICE QUESTION
30 sec • 1 pt
Which of the following is an example of a positive correlation?
As soda consumption increases, age decreases
As age increases, height decreases
As study time increases, test scores decrease
As study time increases, test scores increase
4.
MULTIPLE CHOICE QUESTION
30 sec • 1 pt
What is the relationship between age and soda consumption according to the example?
Inverse correlation
No correlation
Negative correlation
Positive correlation
5.
MULTIPLE CHOICE QUESTION
30 sec • 1 pt
What does a negative correlation indicate?
Both variables increase together
One variable increases while the other decreases
There is no relationship between the variables
Both variables decrease together
6.
MULTIPLE CHOICE QUESTION
30 sec • 1 pt
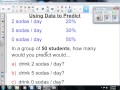
In the survey example, what percentage of students drink two sodas per day?
20%
10%
50%
30%
7.
MULTIPLE CHOICE QUESTION
30 sec • 1 pt
How many students out of 50 are predicted to drink two sodas per day?
15
10
20
5
Access all questions and much more by creating a free account
Create resources
Host any resource
Get auto-graded reports
Continue with Google

Continue with Email
Continue with Classlink
Continue with Clever
or continue with
Microsoft
%20(1).png)
Apple
Others
Already have an account?
