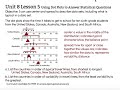
Understanding Center and Spread in Data
Interactive Video
•
Mathematics, Science, Geography
•
6th - 7th Grade
•
Practice Problem
•
Hard

Thomas White
FREE Resource
Read more
10 questions
Show all answers
1.
MULTIPLE CHOICE QUESTION
30 sec • 1 pt
What is the main objective of using dot plots in this lesson?
To learn about different countries
To compare different types of graphs
To describe datasets using center and spread
To create colorful charts
2.
MULTIPLE CHOICE QUESTION
30 sec • 1 pt
Which concept helps in identifying the typical value in a dataset?
Variability
Spread
Center
Range
3.
MULTIPLE CHOICE QUESTION
30 sec • 1 pt
In the context of dot plots, what does the 'center' represent?
The lowest value
The highest value
The average of all values
The middle or balance point
4.
MULTIPLE CHOICE QUESTION
30 sec • 1 pt
Which country was identified as having the shortest typical travel time?
Australia
United States
Canada
South Africa
5.
MULTIPLE CHOICE QUESTION
30 sec • 1 pt
What does variability in a dataset indicate?
The average value
How similar or different the data points are
The range of values
The total number of data points
6.
MULTIPLE CHOICE QUESTION
30 sec • 1 pt
Which two countries had similar starting points in their travel time data?
United States and Canada
New Zealand and Australia
United States and New Zealand
Canada and South Africa
7.
MULTIPLE CHOICE QUESTION
30 sec • 1 pt
Which country had the greatest variability in travel times?
United States
New Zealand
South Africa
Australia
Access all questions and much more by creating a free account
Create resources
Host any resource
Get auto-graded reports
Continue with Google

Continue with Email
Continue with Classlink
Continue with Clever
or continue with
Microsoft
%20(1).png)
Apple
Others
Already have an account?
Similar Resources on Wayground
Popular Resources on Wayground

8 questions
Spartan Way - Classroom Responsible
Quiz
•
9th - 12th Grade
15 questions
Fractions on a Number Line
Quiz
•
3rd Grade
14 questions
Boundaries & Healthy Relationships
Lesson
•
6th - 8th Grade
20 questions
Equivalent Fractions
Quiz
•
3rd Grade
3 questions
Integrity and Your Health
Lesson
•
6th - 8th Grade
25 questions
Multiplication Facts
Quiz
•
5th Grade
9 questions
FOREST Perception
Lesson
•
KG
20 questions
Main Idea and Details
Quiz
•
5th Grade
Discover more resources for Mathematics
12 questions
Review: Surface Area of Rectangular and Triangular Prisms
Quiz
•
6th Grade
36 questions
6th Grade Math STAAR Review
Quiz
•
6th Grade
14 questions
Volume of rectangular prisms
Quiz
•
7th Grade
20 questions
Graphing Inequalities on a Number Line
Quiz
•
6th - 9th Grade
26 questions
Graphing Inequalities on a Number Line
Quiz
•
6th Grade
15 questions
Distributive Property & Review
Quiz
•
6th Grade
20 questions
Math Review
Quiz
•
6th Grade
15 questions
Mean, Median, Mode, and Range
Quiz
•
6th Grade