Phase Changes and Pressure-Temperature Diagrams
Interactive Video
•
Physics, Chemistry, Science
•
11th - 12th Grade
•
Practice Problem
•
Hard

Patricia Brown
FREE Resource
Read more
10 questions
Show all answers
1.
MULTIPLE CHOICE QUESTION
30 sec • 1 pt
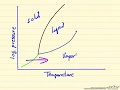
What is the purpose of using a logarithmic scale for pressure in the pressure-temperature diagram?
To make the diagram more colorful
To simplify calculations
To show behavior at high pressures more clearly
To reduce the size of the diagram
2.
MULTIPLE CHOICE QUESTION
30 sec • 1 pt
What does the pressure-temperature diagram represent?
A 4D space-time diagram
A 1D pressure diagram
A 3D pressure-volume-temperature diagram
A 2D temperature-volume diagram
3.
MULTIPLE CHOICE QUESTION
30 sec • 1 pt
Which region on the pressure-temperature diagram is characterized by high pressure and low temperature?
Vapor
Liquid
Solid
Gas
4.
MULTIPLE CHOICE QUESTION
30 sec • 1 pt
What occurs at the phase line between liquid and vapor on the diagram?
A temperature change
A volume decrease
A color change
A phase change
5.
MULTIPLE CHOICE QUESTION
30 sec • 1 pt
What is the critical point on a pressure-temperature diagram?
The point where temperature is zero
The point where solid turns to liquid
The point where pressure is maximum
The point where liquid and vapor are indistinguishable
6.
MULTIPLE CHOICE QUESTION
30 sec • 1 pt
What is a super-critical fluid?
A fluid that is only vapor
A fluid that is neither liquid nor vapor
A fluid that is only liquid
A fluid that is always solid
7.
MULTIPLE CHOICE QUESTION
30 sec • 1 pt
What happens when pressure is increased in most materials?
They turn from solid to liquid
They turn from liquid to solid
They evaporate
They freeze
Access all questions and much more by creating a free account
Create resources
Host any resource
Get auto-graded reports
Continue with Google

Continue with Email
Continue with Classlink
Continue with Clever
or continue with
Microsoft
%20(1).png)
Apple
Others
Already have an account?
