Graph Interpretation and Misleading Data
Interactive Video
•
Mathematics, Science, Other
•
5th - 6th Grade
•
Practice Problem
•
Hard

Patricia Brown
FREE Resource
Read more
10 questions
Show all answers
1.
MULTIPLE CHOICE QUESTION
30 sec • 1 pt
What is the most recent type of graph introduced in the lesson?
Bar Graph
Line Graph
Scatter Plot
Pictograph
2.
MULTIPLE CHOICE QUESTION
30 sec • 1 pt
Which graph is best for showing changes over time?
Circle Graph
Scatter Plot
Line Graph
Bar Graph
3.
MULTIPLE CHOICE QUESTION
30 sec • 1 pt
What type of graph should be used to compare shoe sizes with heights?
Line Graph
Bar Graph
Scatter Plot
Histogram
4.
MULTIPLE CHOICE QUESTION
30 sec • 1 pt
Which graph is suitable for displaying the population of the United States divided into age groups?
Pictograph
Scatter Plot
Histogram
Circle Graph
5.
MULTIPLE CHOICE QUESTION
30 sec • 1 pt
For comparing the percentage of students speaking different languages, which graph is ideal?
Line Graph
Bar Graph
Circle Graph
Scatter Plot
6.
MULTIPLE CHOICE QUESTION
30 sec • 1 pt
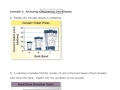
What can cause data to be misleading in a graph?
Using a line graph
Displaying all data points
Using a consistent scale
Changing the scale
7.
MULTIPLE CHOICE QUESTION
30 sec • 1 pt
Why is a break in a graph potentially misleading?
It makes the graph look more colorful
It skips over data that exists
It simplifies the graph
It highlights important data
Access all questions and much more by creating a free account
Create resources
Host any resource
Get auto-graded reports
Continue with Google

Continue with Email
Continue with Classlink
Continue with Clever
or continue with
Microsoft
%20(1).png)
Apple
Others
Already have an account?
