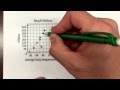
Scatter Plots and Correlation Analysis
Interactive Video
•
Mathematics
•
9th - 10th Grade
•
Practice Problem
•
Hard

Patricia Brown
FREE Resource
Read more
10 questions
Show all answers
1.
MULTIPLE CHOICE QUESTION
30 sec • 1 pt
What is the main topic of Mr. Herman's video?
Probability and Statistics
Pie Charts and Data Analysis
Scatter Plots and Lines of Best Fit
Bar Graphs and Histograms
2.
MULTIPLE CHOICE QUESTION
30 sec • 1 pt
What tool does Mr. Herman suggest using to draw a line of best fit?
A protractor
A calculator
A compass
A piece of plastic
3.
MULTIPLE CHOICE QUESTION
30 sec • 1 pt
What is the correlation between beach visitors and temperature?
Positive correlation
Inverse correlation
Negative correlation
No correlation
4.
MULTIPLE CHOICE QUESTION
30 sec • 1 pt
How many points should ideally be on each side of the line of best fit for the beach visitors vs temperature plot?
9 points
7 points
5 points
3 points
5.
MULTIPLE CHOICE QUESTION
30 sec • 1 pt
What is the predicted number of beach visitors on a 90-degree day?
300 visitors
405 visitors
500 visitors
600 visitors
6.
MULTIPLE CHOICE QUESTION
30 sec • 1 pt
What is the correlation between hours of sleep and test scores?
Positive correlation
Inverse correlation
No correlation
Negative correlation
7.
MULTIPLE CHOICE QUESTION
30 sec • 1 pt
How many points are there in the scatter plot for hours of sleep and test scores?
20 points
25 points
10 points
15 points
Access all questions and much more by creating a free account
Create resources
Host any resource
Get auto-graded reports
Continue with Google

Continue with Email
Continue with Classlink
Continue with Clever
or continue with
Microsoft
%20(1).png)
Apple
Others
Already have an account?
