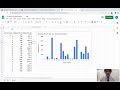
Graphing and Data Analysis in Google Sheets
Interactive Video
•
Chemistry, Computers, Science
•
9th - 10th Grade
•
Practice Problem
•
Hard

Patricia Brown
FREE Resource
Read more
10 questions
Show all answers
1.
MULTIPLE CHOICE QUESTION
30 sec • 1 pt
What is the primary purpose of using Google Sheets in this tutorial?
To write essays
To create and analyze graphs
To design websites
To edit videos
2.
MULTIPLE CHOICE QUESTION
30 sec • 1 pt
Which data is first entered into Google Sheets for graphing?
C inquired and atomic number
Atomic number and O in oxide
Boiling point and atomic number
Melting point and atomic number
3.
MULTIPLE CHOICE QUESTION
30 sec • 1 pt
What type of chart is recommended for visualizing the data?
Area chart
Bar chart
Line chart
Pie chart
4.
MULTIPLE CHOICE QUESTION
30 sec • 1 pt
How do you ensure the atomic numbers are in order in the chart?
By using the sort range feature
By using a filter
By deleting and re-entering the data
By manually rearranging them
5.
MULTIPLE CHOICE QUESTION
30 sec • 1 pt
What is the formula to convert Celsius to Kelvin?
K = C + 273.15
K = C + 100
K = C - 273.15
K = C + 32
6.
MULTIPLE CHOICE QUESTION
30 sec • 1 pt
What is the next step after converting Celsius to Kelvin in the spreadsheet?
Create a pie chart
Create a line chart
Create a scatter plot
Create a bar chart
7.
MULTIPLE CHOICE QUESTION
30 sec • 1 pt
What additional graphs are students asked to create?
Graphs for speed and time
Graphs for melting points and C inquired
Graphs for density and volume
Graphs for mass and weight
Access all questions and much more by creating a free account
Create resources
Host any resource
Get auto-graded reports
Continue with Google

Continue with Email
Continue with Classlink
Continue with Clever
or continue with
Microsoft
%20(1).png)
Apple
Others
Already have an account?
Popular Resources on Wayground

15 questions
Fractions on a Number Line
Quiz
•
3rd Grade
10 questions
Probability Practice
Quiz
•
4th Grade
15 questions
Probability on Number LIne
Quiz
•
4th Grade
20 questions
Equivalent Fractions
Quiz
•
3rd Grade
25 questions
Multiplication Facts
Quiz
•
5th Grade
22 questions
fractions
Quiz
•
3rd Grade
6 questions
Appropriate Chromebook Usage
Lesson
•
7th Grade
10 questions
Greek Bases tele and phon
Quiz
•
6th - 8th Grade
Discover more resources for Chemistry
20 questions
Predicting Products
Quiz
•
9th - 12th Grade
11 questions
Balancing Chemical Equations
Lesson
•
9th Grade
10 questions
Exploring Types of Chemical Reactions
Interactive video
•
6th - 10th Grade
19 questions
Stoichiometry, % yield, Limiting Reactants
Quiz
•
10th Grade
20 questions
Types of Chemical Reactions
Quiz
•
9th - 12th Grade
10 questions
Exploring Ionic and Covalent Bonding Concepts
Interactive video
•
6th - 10th Grade
7 questions
GCSE Chemistry - Balancing Chemical Equations #4
Interactive video
•
9th - 10th Grade
12 questions
Percent Yield
Quiz
•
10th Grade