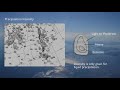
Radar Summary Chart Interpretations
Interactive Video
•
Science, Geography, Other
•
9th - 10th Grade
•
Practice Problem
•
Hard

Patricia Brown
FREE Resource
Read more
10 questions
Show all answers
1.
MULTIPLE CHOICE QUESTION
30 sec • 1 pt
What does the radar summary chart primarily display?
Temperature variations
Wind patterns
Precipitation data
Cloud formations
2.
MULTIPLE CHOICE QUESTION
30 sec • 1 pt
Which contour on the radar summary chart indicates heavy precipitation?
First contour
Fourth contour
Second contour
Third contour
3.
MULTIPLE CHOICE QUESTION
30 sec • 1 pt
What does the third contour on the radar summary chart represent?
Light precipitation
Moderate precipitation
No precipitation
Extreme precipitation
4.
MULTIPLE CHOICE QUESTION
30 sec • 1 pt
How is a line of thunderstorms represented on the radar summary chart?
Dotted line
Solid line
Dashed line
Wavy line
5.
MULTIPLE CHOICE QUESTION
30 sec • 1 pt
What does the letter 'R' indicate on the radar summary chart?
Rain
Snow
Hail
Thunderstorm
6.
MULTIPLE CHOICE QUESTION
30 sec • 1 pt
What does 'LM' signify on the radar summary chart?
Light Mist
Little Movement
Large Movement
Low Moisture
7.
MULTIPLE CHOICE QUESTION
30 sec • 1 pt
What does a small black dot on the radar summary chart indicate?
Radar site under maintenance
Presence of a tornado
Area of no precipitation
Location of maximum tops
Access all questions and much more by creating a free account
Create resources
Host any resource
Get auto-graded reports
Continue with Google

Continue with Email
Continue with Classlink
Continue with Clever
or continue with
Microsoft
%20(1).png)
Apple
Others
Already have an account?
