Analyzing Climate Graphs to Understand Weather Patterns
Interactive Video
•
Geography, Science, Other
•
6th - 8th Grade
•
Practice Problem
•
Hard

Patricia Brown
FREE Resource
Read more
10 questions
Show all answers
1.
MULTIPLE CHOICE QUESTION
30 sec • 1 pt
What does a climate graph typically represent?
Average humidity and wind speed
Average wind speed and precipitation
Average temperature and precipitation
Average temperature and humidity
2.
MULTIPLE CHOICE QUESTION
30 sec • 1 pt
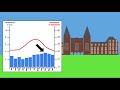
In which month is the average temperature in Amsterdam the highest?
January
May
August
December
3.
MULTIPLE CHOICE QUESTION
30 sec • 1 pt
How is precipitation typically shown on a climate graph?
As a line graph
As a bar graph
As a pie chart
As a scatter plot
4.
MULTIPLE CHOICE QUESTION
30 sec • 1 pt
What can a climate graph tell us about a location's proximity to the equator?
The average temperature is high near the equator
The average temperature is low near the equator
The temperature difference between summer and winter is minimal near the equator
There is no precipitation near the equator
5.
MULTIPLE CHOICE QUESTION
30 sec • 1 pt
If a place has a warm period in December and January, where is it likely located?
Far from the equator
Northern Hemisphere
Southern Hemisphere
Near the equator
6.
MULTIPLE CHOICE QUESTION
30 sec • 1 pt
What does a large temperature difference between summer and winter indicate about a location?
It is near the equator
It is far from the equator
It is near a sea
It is in a desert
7.
MULTIPLE CHOICE QUESTION
30 sec • 1 pt
How can precipitation patterns help determine a location's distance from the sea?
Less precipitation indicates a location is further inland
More precipitation indicates a location is further inland
Precipitation is always higher near the sea
Precipitation patterns do not indicate distance from the sea
Access all questions and much more by creating a free account
Create resources
Host any resource
Get auto-graded reports
Continue with Google

Continue with Email
Continue with Classlink
Continue with Clever
or continue with
Microsoft
%20(1).png)
Apple
Others
Already have an account?
