Climate Graph Insights: Analyzing Temperature and Precipitation Patterns
Interactive Video
•
Geography, Science, Mathematics
•
6th - 8th Grade
•
Practice Problem
•
Hard

Patricia Brown
FREE Resource
Read more
10 questions
Show all answers
1.
MULTIPLE CHOICE QUESTION
30 sec • 1 pt
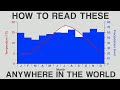
What are the two main elements typically shown in a basic climate graph?
Temperature and humidity
Temperature and precipitation
Precipitation and wind speed
Humidity and wind speed
2.
MULTIPLE CHOICE QUESTION
30 sec • 1 pt
When constructing a climate graph, what is typically used to label the x-axis?
First letter of each month
Full names of the months
Numbers representing each month
Seasons of the year
3.
MULTIPLE CHOICE QUESTION
30 sec • 1 pt
What is the maximum value suggested for the y-axis when plotting temperature in the example provided?
30 degrees Celsius
25 degrees Celsius
20 degrees Celsius
15 degrees Celsius
4.
MULTIPLE CHOICE QUESTION
30 sec • 1 pt
Which color is often used to represent precipitation in climate graphs?
Yellow
Blue
Green
Red
5.
MULTIPLE CHOICE QUESTION
30 sec • 1 pt
How is temperature typically represented on a climate graph?
As a bar graph
As a line graph
As a pie chart
As a scatter plot
6.
MULTIPLE CHOICE QUESTION
30 sec • 1 pt
What is the temperature range for Manaus, Brazil, as mentioned in the video?
30 to 32 degrees Celsius
25 to 27 degrees Celsius
20 to 22 degrees Celsius
15 to 17 degrees Celsius
7.
MULTIPLE CHOICE QUESTION
30 sec • 1 pt
Which location is described as having extremely low precipitation, qualifying it as a desert?
Death Valley, USA
Manaus, Brazil
Sydney, Australia
Vostok Station, Antarctica
Access all questions and much more by creating a free account
Create resources
Host any resource
Get auto-graded reports
Continue with Google

Continue with Email
Continue with Classlink
Continue with Clever
or continue with
Microsoft
%20(1).png)
Apple
Others
Already have an account?
