Graphing Linear Inequalities
Interactive Video
•
Mathematics
•
6th - 9th Grade
•
Practice Problem
•
Medium
+2
Standards-aligned

Lucas Foster
Used 5+ times
FREE Resource
Standards-aligned
Read more
10 questions
Show all answers
1.
MULTIPLE CHOICE QUESTION
30 sec • 1 pt
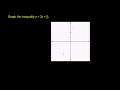
What is the inequality that needs to be graphed?
y > 3x + 5
y ≤ 3x + 5
y < 3x + 5
y = 3x + 5
Tags
CCSS.8.EE.B.6
CCSS.8.F.A.3
2.
MULTIPLE CHOICE QUESTION
30 sec • 1 pt
What is the y-intercept of the line y = 3x + 5?
3
0
5
8
Tags
CCSS.8.EE.B.5
3.
MULTIPLE CHOICE QUESTION
30 sec • 1 pt
What does the slope of 3 indicate in the line y = 3x + 5?
Move 1 unit down for every 3 units left
Move 3 units down for every 1 unit left
Move 1 unit up for every 3 units right
Move 3 units up for every 1 unit right
Tags
CCSS.HSA.REI.D.12
4.
MULTIPLE CHOICE QUESTION
30 sec • 1 pt
Why is a dotted line used for the inequality y < 3x + 5?
To include the line in the solution
To exclude the line from the solution
To indicate a solid boundary
To show a vertical line
5.
MULTIPLE CHOICE QUESTION
30 sec • 1 pt
If x = 0, what is the value of y in the inequality y < 3x + 5?
y < 0
y < 8
y < 5
y < 3
Tags
CCSS.6.EE.B.5
6.
MULTIPLE CHOICE QUESTION
30 sec • 1 pt
If x = 1, what is the value of y in the inequality y < 3x + 5?
y < 10
y < 8
y < 5
y < 3
Tags
CCSS.HSA.REI.D.12
7.
MULTIPLE CHOICE QUESTION
30 sec • 1 pt
What does the area below the dotted line represent in the graph of y < 3x + 5?
Values of y greater than 3x + 5
Values of y greater than or equal to 3x + 5
Values of y equal to 3x + 5
Values of y less than 3x + 5
Tags
CCSS.HSA.REI.D.12
Access all questions and much more by creating a free account
Create resources
Host any resource
Get auto-graded reports
Continue with Google

Continue with Email
Continue with Classlink
Continue with Clever
or continue with
Microsoft
%20(1).png)
Apple
Others
Already have an account?
