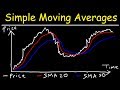
Understanding Simple Moving Averages
Interactive Video
•
Mathematics, Business
•
9th - 12th Grade
•
Practice Problem
•
Hard

Lucas Foster
FREE Resource
Read more
10 questions
Show all answers
1.
MULTIPLE CHOICE QUESTION
30 sec • 1 pt
What is a Simple Moving Average (SMA)?
The average opening price of a stock over a period
The average closing price of a stock over a period
The lowest price of a stock in a day
The highest price of a stock in a day
2.
MULTIPLE CHOICE QUESTION
30 sec • 1 pt
How is the SMA value affected when the stock price increases?
The SMA value remains constant
The SMA value increases
The SMA value becomes zero
The SMA value decreases
3.
MULTIPLE CHOICE QUESTION
30 sec • 1 pt
What does it indicate if the stock price is above the SMA?
The stock is about to crash
The stock is in a downtrend
The stock is in an uptrend
The stock price is stable
4.
MULTIPLE CHOICE QUESTION
30 sec • 1 pt
What is the purpose of the SMA 200?
To predict future stock prices
To calculate daily stock prices
To identify long-term trends
To identify short-term trends
5.
MULTIPLE CHOICE QUESTION
30 sec • 1 pt
In a graph, what does it mean when the SMA curve crosses the price curve?
A trend continuation
A market crash
A stable market
A trend reversal
6.
MULTIPLE CHOICE QUESTION
30 sec • 1 pt
What is a trend reversal in stock trading?
When the stock price hits a new low
When the stock price hits a new high
When the SMA curve crosses the price curve
When the stock price remains constant
7.
MULTIPLE CHOICE QUESTION
30 sec • 1 pt
How does the SMA 20 compare to the SMA 50 in terms of volatility?
SMA 20 is less volatile
SMA 50 is more volatile
SMA 20 is more volatile
Both have the same volatility
Access all questions and much more by creating a free account
Create resources
Host any resource
Get auto-graded reports
Continue with Google

Continue with Email
Continue with Classlink
Continue with Clever
or continue with
Microsoft
%20(1).png)
Apple
Others
Already have an account?
