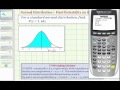
Understanding Z-Scores and Probability with TI-84
Interactive Video
•
Mathematics, Science
•
9th - 12th Grade
•
Practice Problem
•
Hard

Liam Anderson
FREE Resource
Read more
10 questions
Show all answers
1.
MULTIPLE CHOICE QUESTION
30 sec • 1 pt
What is the purpose of using the TI-84 calculator in this tutorial?
To calculate the mean of a data set
To determine the probability of a z-score being less than a given value
To find the median of a data set
To solve linear equations
2.
MULTIPLE CHOICE QUESTION
30 sec • 1 pt
In a standard normal distribution, what does the area under the curve to the left of a z-score represent?
The mean of the distribution
The probability of the z-score
The standard deviation
The mode of the distribution
3.
MULTIPLE CHOICE QUESTION
30 sec • 1 pt
Which feature on the TI-84 calculator is used to find the probability of a z-score?
NormalCDF
NormalPDF
StatPlot
InvNorm
4.
MULTIPLE CHOICE QUESTION
30 sec • 1 pt
What values are entered into the normal CDF function to calculate probability?
Lower and upper bounds, mean, and standard deviation
Mean and median
Variance and interquartile range
Mode and range
5.
MULTIPLE CHOICE QUESTION
30 sec • 1 pt
What is the typical lower bound z-score used in this tutorial?
0
1.64
-99,999
3
6.
MULTIPLE CHOICE QUESTION
30 sec • 1 pt
Why is a very low value like -99,999 used as the lower bound z-score?
To match the upper bound
To ensure all area to the left is included
To simplify calculations
To avoid errors in the calculator
7.
MULTIPLE CHOICE QUESTION
30 sec • 1 pt
What should the values of mu and sigma be set to for standard normal distribution calculations?
Mu = 1, Sigma = 0
Mu = 0, Sigma = 1
Mu = 1, Sigma = 1
Mu = 0, Sigma = 0
Access all questions and much more by creating a free account
Create resources
Host any resource
Get auto-graded reports
Continue with Google

Continue with Email
Continue with Classlink
Continue with Clever
or continue with
Microsoft
%20(1).png)
Apple
Others
Already have an account?
