Understanding Obesity Rate Calculation
Interactive Video
•
Mathematics
•
7th - 10th Grade
•
Practice Problem
•
Hard
+2
Standards-aligned

Aiden Montgomery
FREE Resource
Standards-aligned
Read more
10 questions
Show all answers
1.
MULTIPLE CHOICE QUESTION
30 sec • 1 pt
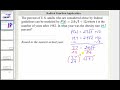
What is the mathematical model used to represent the obesity rate of U.S. adults?
p(t) = 3.5 * t + 10
p(t) = 2.9 * sqrt(t) + 12
p(t) = 2.9 * t^2 + 12
p(t) = 3.5 * sqrt(t) + 10
Tags
CCSS.HSF.LE.B.5
2.
MULTIPLE CHOICE QUESTION
30 sec • 1 pt
In the given model, what does the variable 't' represent?
The number of years after 1990
The number of years after 1982
The number of years after 1980
The number of years after 2000
Tags
CCSS.HSF.IF.A.2
3.
MULTIPLE CHOICE QUESTION
30 sec • 1 pt
What value is substituted for p(t) to find the year when the obesity rate was 19.7%?
7.7
19.7
12
2.9
Tags
CCSS.HSA.REI.A.2
4.
MULTIPLE CHOICE QUESTION
30 sec • 1 pt
What is the first step in isolating the square root in the equation?
Add 12 to both sides
Multiply both sides by 2.9
Divide both sides by 2.9
Subtract 12 from both sides
Tags
CCSS.HSA.REI.A.2
5.
MULTIPLE CHOICE QUESTION
30 sec • 1 pt
After isolating the square root, what operation is performed next?
Multiply both sides by 2.9
Subtract 12 from both sides
Square both sides
Add 12 to both sides
Tags
CCSS.7.EE.B.4A
6.
MULTIPLE CHOICE QUESTION
30 sec • 1 pt
What is the approximate value of t after solving the equation?
7.05
6.05
9.05
8.05
7.
MULTIPLE CHOICE QUESTION
30 sec • 1 pt
To the nearest year, what is the value of t?
9
8
7
6
Tags
CCSS.HSF.IF.A.2
Access all questions and much more by creating a free account
Create resources
Host any resource
Get auto-graded reports
Continue with Google

Continue with Email
Continue with Classlink
Continue with Clever
or continue with
Microsoft
%20(1).png)
Apple
Others
Already have an account?
