- Resource Library
- Math
- Probability And Statistics
- Five Number Summary
- Understanding Quartiles And Five Number Summary
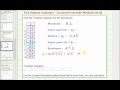
Understanding Quartiles and Five Number Summary
Interactive Video
•
Mathematics
•
6th - 10th Grade
•
Practice Problem
•
Hard
+2
Standards-aligned

Jackson Turner
FREE Resource
Standards-aligned
Read more
10 questions
Show all answers
1.
MULTIPLE CHOICE QUESTION
30 sec • 1 pt
What are the components of the five number summary?
Q1, Q2, Q3, Q4, Q5
Mean, Median, Mode, Range, Variance
Minimum, Q1, Median, Q3, Maximum
Minimum, Maximum, Mean, Mode, Range
Tags
CCSS.6.SP.B.5C
2.
MULTIPLE CHOICE QUESTION
30 sec • 1 pt
Why is it important to use the locator percentile method for quartiles?
It is easier to understand.
It provides more accurate quartile values.
It is faster than other methods.
It is the only method available.
Tags
CCSS.6.SP.B.5A
3.
MULTIPLE CHOICE QUESTION
30 sec • 1 pt
What is the minimum value in the given data set?
27.3
11.05
8.3
3.2
Tags
CCSS.6.SP.B.5C
4.
MULTIPLE CHOICE QUESTION
30 sec • 1 pt
How is the median calculated when the number of data values is even?
By taking the middle value directly.
By averaging the two middle values.
By using the largest value.
By using the smallest value.
Tags
CCSS.6.SP.B.5C
5.
MULTIPLE CHOICE QUESTION
30 sec • 1 pt
What is the median of the given data set?
13.8
11.05
8.3
20.9
Tags
CCSS.6.SP.B.5C
6.
MULTIPLE CHOICE QUESTION
30 sec • 1 pt
What formula is used to find Q1 using the locator percentile method?
L = 0.5 * n
L = 0.75 * n
L = 0.25 * n
L = n / 2
Tags
CCSS.6.SP.B.5C
7.
MULTIPLE CHOICE QUESTION
30 sec • 1 pt
In which position is Q1 located in the given data set?
Eighth
Fifth
Third
Second
Tags
CCSS.6.SP.B.5C
Access all questions and much more by creating a free account
Create resources
Host any resource
Get auto-graded reports
Continue with Google

Continue with Email
Continue with Classlink
Continue with Clever
or continue with
Microsoft
%20(1).png)
Apple
Others
Already have an account?
