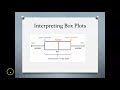
Interpreting Box Plots Effectively
Interactive Video
•
Mathematics
•
6th - 10th Grade
•
Practice Problem
•
Hard
Standards-aligned

Ethan Morris
Used 2+ times
FREE Resource
Standards-aligned
Read more
10 questions
Show all answers
1.
MULTIPLE CHOICE QUESTION
30 sec • 1 pt
What does a box plot visually represent?
The mean and mode of a dataset
A summary of a dataset divided into quartiles
The total range of a dataset
The standard deviation of a dataset
Tags
CCSS.6.SP.B.4
CCSS.HSS.ID.A.1
2.
MULTIPLE CHOICE QUESTION
30 sec • 1 pt
What is the median in a box plot?
The highest value of the dataset
The middle value of the dataset
The average value of the dataset
The middle value of the upper quartile
Tags
CCSS.6.SP.B.4
CCSS.HSS.ID.A.1
3.
MULTIPLE CHOICE QUESTION
30 sec • 1 pt
How is the interquartile range (IQR) calculated?
Median - Lower quartile
Upper quartile - Lower quartile
Upper quartile + Lower quartile
Maximum value - Minimum value
Tags
CCSS.6.SP.B.5C
4.
MULTIPLE CHOICE QUESTION
30 sec • 1 pt
What does the lower quartile represent?
The average score of the dataset
25% of the lowest scores
25% of the highest scores
The median of the dataset
Tags
CCSS.6.SP.B.5C
5.
MULTIPLE CHOICE QUESTION
30 sec • 1 pt
Can you determine the mean from a box plot?
Yes, it's the middle of the box
No, a box plot does not provide individual data points
No, unless the dataset is provided separately
Yes, by calculating the average of the quartiles
Tags
CCSS.6.SP.B.4
CCSS.HSS.ID.A.1
6.
MULTIPLE CHOICE QUESTION
30 sec • 1 pt
What percentage of students scored 60 or better?
100%
75%
50%
25%
7.
MULTIPLE CHOICE QUESTION
30 sec • 1 pt
What is the range of the biology test scores?
85
60
35
25
Tags
CCSS.6.SP.B.4
CCSS.HSS.ID.A.1
Access all questions and much more by creating a free account
Create resources
Host any resource
Get auto-graded reports
Continue with Google

Continue with Email
Continue with Classlink
Continue with Clever
or continue with
Microsoft
%20(1).png)
Apple
Others
Already have an account?
Popular Resources on Wayground

15 questions
Fractions on a Number Line
Quiz
•
3rd Grade
20 questions
Equivalent Fractions
Quiz
•
3rd Grade
25 questions
Multiplication Facts
Quiz
•
5th Grade
29 questions
Alg. 1 Section 5.1 Coordinate Plane
Quiz
•
9th Grade
22 questions
fractions
Quiz
•
3rd Grade
11 questions
FOREST Effective communication
Lesson
•
KG
20 questions
Main Idea and Details
Quiz
•
5th Grade
20 questions
Context Clues
Quiz
•
6th Grade
Discover more resources for Mathematics
29 questions
Alg. 1 Section 5.1 Coordinate Plane
Quiz
•
9th Grade
36 questions
6th Grade Math STAAR Review
Quiz
•
6th Grade
14 questions
Volume of rectangular prisms
Quiz
•
7th Grade
14 questions
finding slope from a graph
Quiz
•
8th Grade
20 questions
Graphing Inequalities on a Number Line
Quiz
•
6th - 9th Grade
23 questions
Solve and Graph Inequalities
Quiz
•
6th Grade
15 questions
Distributive Property & Review
Quiz
•
6th Grade
10 questions
Mean, Median, Mode, and Range
Quiz
•
7th Grade