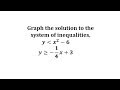
Graphing and Analyzing Inequalities
Interactive Video
•
Mathematics
•
8th - 10th Grade
•
Practice Problem
•
Hard
Standards-aligned

Aiden Montgomery
FREE Resource
Standards-aligned
Read more
10 questions
Show all answers
1.
MULTIPLE CHOICE QUESTION
30 sec • 1 pt
What is the solution to a system of inequalities?
The region below both graphs
The region where the graphs do not overlap
The region above both graphs
The region where the graphs overlap
Tags
CCSS.HSF-IF.C.7A
2.
MULTIPLE CHOICE QUESTION
30 sec • 1 pt
How is the graph of y < x^2 - 6 represented?
As a solid line
As a dashed line
As a dashed parabola
As a solid parabola
3.
MULTIPLE CHOICE QUESTION
30 sec • 1 pt
What is the vertex of the parabola y = x^2 - 6?
(0, 0)
(0, -6)
(6, 0)
(-6, 0)
Tags
CCSS.HSA.REI.D.12
4.
MULTIPLE CHOICE QUESTION
30 sec • 1 pt
Which region is shaded for the inequality y < x^2 - 6?
Above the parabola
Below the parabola
Inside the parabola
On the parabola
5.
MULTIPLE CHOICE QUESTION
30 sec • 1 pt
What test point is used to verify the shading of the quadratic inequality?
(-1, -1)
(0, 0)
(2, 2)
(1, 1)
Tags
CCSS.HSA.REI.D.12
6.
MULTIPLE CHOICE QUESTION
30 sec • 1 pt
How is the graph of y >= -1/4x + 3 represented?
As a solid line
As a dashed line
As a solid parabola
As a dashed parabola
Tags
CCSS.8.EE.B.5
7.
MULTIPLE CHOICE QUESTION
30 sec • 1 pt
What is the slope of the line y = -1/4x + 3?
-1/4
-4
4
1/4
Tags
CCSS.HSA.REI.D.12
Access all questions and much more by creating a free account
Create resources
Host any resource
Get auto-graded reports
Continue with Google

Continue with Email
Continue with Classlink
Continue with Clever
or continue with
Microsoft
%20(1).png)
Apple
Others
Already have an account?
