Understanding Solubility Curves
Interactive Video
•
Chemistry, Science
•
8th - 10th Grade
•
Practice Problem
•
Medium

Ethan Morris
Used 17+ times
FREE Resource
Read more
10 questions
Show all answers
1.
MULTIPLE CHOICE QUESTION
30 sec • 1 pt
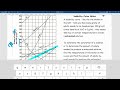
What does the y-axis represent on a solubility curve?
Pressure in atmospheres
Temperature in degrees Celsius
Volume of water in liters
Grams of solute per 100 grams of water
2.
MULTIPLE CHOICE QUESTION
30 sec • 1 pt
What is the density of water that equates 100 grams to 100 milliliters?
2 grams per milliliter
1 gram per milliliter
10 grams per milliliter
0.5 grams per milliliter
3.
MULTIPLE CHOICE QUESTION
30 sec • 1 pt
How is a saturated solution represented on a solubility curve?
To the left of the curve
Above the curve
Below the curve
On the curve
4.
MULTIPLE CHOICE QUESTION
30 sec • 1 pt
What is the term for a solution that contains less solute than the saturation point?
Unsaturated
Saturated
Concentrated
Supersaturated
5.
MULTIPLE CHOICE QUESTION
30 sec • 1 pt
If you dissolve more solute than the saturation point allows, what type of solution is formed?
Dilute
Supersaturated
Unsaturated
Saturated
6.
MULTIPLE CHOICE QUESTION
30 sec • 1 pt
How can you create a supersaturated solution?
By adding more solvent
By heating a solution and then cooling it
By stirring continuously
By cooling a saturated solution
7.
MULTIPLE CHOICE QUESTION
30 sec • 1 pt
What happens to the solubility of NH3 as the temperature increases?
It increases
It decreases
It remains constant
It fluctuates
Access all questions and much more by creating a free account
Create resources
Host any resource
Get auto-graded reports
Continue with Google

Continue with Email
Continue with Classlink
Continue with Clever
or continue with
Microsoft
%20(1).png)
Apple
Others
Already have an account?
