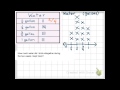
Creating Line Plots with Measurement Data
Interactive Video
•
Mathematics
•
6th - 10th Grade
•
Practice Problem
•
Hard
+1
Standards-aligned

Lucas Foster
FREE Resource
Standards-aligned
Read more
10 questions
Show all answers
1.
MULTIPLE CHOICE QUESTION
30 sec • 1 pt
What is the primary goal of the lesson?
To understand the importance of hydration
To learn how to display measurement data in a line plot
To memorize daily water intake
To compare different types of graphs
Tags
CCSS.3.MD.B.4
2.
MULTIPLE CHOICE QUESTION
30 sec • 1 pt
What is the first step in creating any kind of graph according to the lesson?
Analyzing the data
Collecting data
Labeling the graph
Plotting the data
3.
MULTIPLE CHOICE QUESTION
30 sec • 1 pt
What unit of measurement is used for the line plot?
Liters
Cups
Gallons
Milliliters
Tags
CCSS.3.MD.B.4
4.
MULTIPLE CHOICE QUESTION
30 sec • 1 pt
How many days did the teacher drink one-fourth of a gallon of water?
Four days
Three days
Five days
Two days
Tags
CCSS.4.MD.A.2
5.
MULTIPLE CHOICE QUESTION
30 sec • 1 pt
How many tally marks were made for half a gallon of water consumption?
Five
Three
Two
Four
Tags
CCSS.3.MD.A.2
6.
MULTIPLE CHOICE QUESTION
30 sec • 1 pt
What mathematical operation is used to find the difference between the greatest and least amounts of water consumed?
Addition
Subtraction
Multiplication
Division
Tags
CCSS.4.MD.B.4
7.
MULTIPLE CHOICE QUESTION
30 sec • 1 pt
What is the difference between the greatest and least amount of water consumed?
One gallon
Three-fourths of a gallon
One-half of a gallon
One-fourth of a gallon
Tags
CCSS.4.MD.B.4
Access all questions and much more by creating a free account
Create resources
Host any resource
Get auto-graded reports
Continue with Google

Continue with Email
Continue with Classlink
Continue with Clever
or continue with
Microsoft
%20(1).png)
Apple
Others
Already have an account?
