Exploring Probability through Venn Diagrams
Interactive Video
•
Mathematics
•
6th - 10th Grade
•
Practice Problem
•
Hard
+3
Standards-aligned

Lucas Foster
FREE Resource
Standards-aligned
10 questions
Show all answers
1.
MULTIPLE CHOICE QUESTION
30 sec • 1 pt
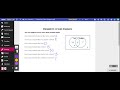
What does the number 8 in the middle section of the Venn diagram represent?
Students who prefer coffee over tea
Students with no preference between tea and coffee
Students who dislike both tea and coffee
Students who prefer tea over coffee
Tags
CCSS.HSS.CP.A.1
2.
MULTIPLE CHOICE QUESTION
30 sec • 1 pt
How many students in total were surveyed about their drink preferences?
21 students
28 students
15 students
30 students
Tags
CCSS.6.SP.B.5A
3.
MULTIPLE CHOICE QUESTION
30 sec • 1 pt
In the psychology and sociology scenario, how many students take only psychology?
18 students
11 students
30 students
12 students
Tags
CCSS.8.SP.A.4
4.
MULTIPLE CHOICE QUESTION
30 sec • 1 pt
How many students are taking classes other than psychology and sociology?
9 students
18 students
41 students
12 students
Tags
CCSS.8.SP.A.4
5.
MULTIPLE CHOICE QUESTION
30 sec • 1 pt
What is the probability of a student taking sociology?
46%
50%
24%
12%
Tags
CCSS.7.SP.A.2
6.
MULTIPLE CHOICE QUESTION
30 sec • 1 pt
What is the probability of a student not taking psychology?
2/5
40%
50%
20%
Tags
CCSS.7.SP.C.7B
7.
MULTIPLE CHOICE QUESTION
30 sec • 1 pt
What is the probability of a student taking both psychology and sociology?
50%
12/50
6/25
24%
Tags
CCSS.8.SP.A.4
Access all questions and much more by creating a free account
Create resources
Host any resource
Get auto-graded reports
Continue with Google

Continue with Email
Continue with Classlink
Continue with Clever
or continue with
Microsoft
%20(1).png)
Apple
Others
Already have an account?
