Creating and Analyzing Histograms
Interactive Video
•
Mathematics
•
6th - 10th Grade
•
Practice Problem
•
Medium
Standards-aligned

Amelia Wright
Used 11+ times
FREE Resource
Standards-aligned
Read more
10 questions
Show all answers
1.
MULTIPLE CHOICE QUESTION
30 sec • 1 pt
What does the width of a bar in a histogram typically represent?
The mode of the data
The interval or range of the data
The total number of data points
The frequency of the data
Tags
CCSS.6.SP.B.4
CCSS.HSS.ID.A.1
2.
MULTIPLE CHOICE QUESTION
30 sec • 1 pt
What does the height of a bar in a histogram represent?
The interval of the data
The total number of data points
The width of the interval
The frequency of the data within an interval
Tags
CCSS.6.SP.B.4
CCSS.HSS.ID.A.1
3.
MULTIPLE CHOICE QUESTION
30 sec • 1 pt
Why are there no spaces between the bars in a histogram?
To indicate continuous data
To save space on the graph
To make the graph easier to read
To differentiate it from a bar chart
Tags
CCSS.6.SP.B.4
CCSS.HSS.ID.A.1
4.
MULTIPLE CHOICE QUESTION
30 sec • 1 pt
What is the purpose of using bins in a histogram?
To determine the total number of data points
To categorize data into intervals
To measure the width of the graph
To calculate the mean of the data
Tags
CCSS.6.SP.B.4
CCSS.HSS.ID.A.1
5.
MULTIPLE CHOICE QUESTION
30 sec • 1 pt
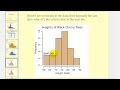
What is the mode of the wait times in the given histogram example?
5 to 6 minutes
4 to 5 minutes
3 to 4 minutes
2 to 3 minutes
Tags
CCSS.6.SP.B.4
CCSS.HSS.ID.A.1
6.
MULTIPLE CHOICE QUESTION
30 sec • 1 pt
How many bins are used in the histogram example provided?
Five
Six
Eight
Seven
Tags
CCSS.6.SP.B.4
CCSS.HSS.ID.A.1
7.
MULTIPLE CHOICE QUESTION
30 sec • 1 pt
How is the mode identified in a histogram?
It is the shortest bar
It is the tallest bar
It is the last bar
It is the first bar
Tags
CCSS.6.SP.B.4
CCSS.HSS.ID.A.1
Access all questions and much more by creating a free account
Create resources
Host any resource
Get auto-graded reports
Continue with Google

Continue with Email
Continue with Classlink
Continue with Clever
or continue with
Microsoft
%20(1).png)
Apple
Others
Already have an account?
