Exploring Surveys and Graphical Representations
Interactive Video
•
Mathematics
•
1st - 5th Grade
•
Practice Problem
•
Medium
Standards-aligned

Amelia Wright
Used 2+ times
FREE Resource
Standards-aligned
10 questions
Show all answers
1.
MULTIPLE CHOICE QUESTION
30 sec • 1 pt
What does each star represent in the pictograph discussed?
One book
Two books
Ten books
Five books
2.
MULTIPLE CHOICE QUESTION
30 sec • 1 pt
What is the purpose of a key in a pictograph?
To lock the data
To explain what each picture stands for
To color the graph
To count the votes
Tags
CCSS.2.MD.D.10
3.
MULTIPLE CHOICE QUESTION
30 sec • 1 pt
Which subject received the most votes according to the pictograph?
History
Science
Math
English
Tags
CCSS.1.MD.C.4
4.
MULTIPLE CHOICE QUESTION
30 sec • 1 pt
How many votes did social studies receive?
Three
Five
Two
Four
Tags
CCSS.1.MD.C.4
5.
MULTIPLE CHOICE QUESTION
30 sec • 1 pt
What does each pencil in the pictograph represent?
One teacher
One student
One vote
One book
Tags
CCSS.1.MD.C.4
6.
MULTIPLE CHOICE QUESTION
30 sec • 1 pt
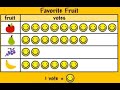
How many people voted for pears as their favorite fruit?
Five
Six
Seven
Eight
Tags
CCSS.1.MD.C.4
7.
MULTIPLE CHOICE QUESTION
30 sec • 1 pt
What is the first step in creating a pictograph from survey data?
Drawing smiley faces
Writing the title
Picking a key symbol
Counting the votes
Tags
CCSS.2.MD.D.10
Access all questions and much more by creating a free account
Create resources
Host any resource
Get auto-graded reports
Continue with Google

Continue with Email
Continue with Classlink
Continue with Clever
or continue with
Microsoft
%20(1).png)
Apple
Others
Already have an account?
Similar Resources on Wayground
Popular Resources on Wayground

8 questions
Spartan Way - Classroom Responsible
Quiz
•
9th - 12th Grade
15 questions
Fractions on a Number Line
Quiz
•
3rd Grade
14 questions
Boundaries & Healthy Relationships
Lesson
•
6th - 8th Grade
20 questions
Equivalent Fractions
Quiz
•
3rd Grade
3 questions
Integrity and Your Health
Lesson
•
6th - 8th Grade
25 questions
Multiplication Facts
Quiz
•
5th Grade
9 questions
FOREST Perception
Lesson
•
KG
20 questions
Main Idea and Details
Quiz
•
5th Grade
Discover more resources for Mathematics
15 questions
Fractions on a Number Line
Quiz
•
3rd Grade
20 questions
Equivalent Fractions
Quiz
•
3rd Grade
25 questions
Multiplication Facts
Quiz
•
5th Grade
15 questions
Equivalent Fractions
Quiz
•
4th Grade
18 questions
Comparing Fractions with same numerator or denominator
Quiz
•
3rd Grade
10 questions
Wayground Quiz Review for G2 Benchmark 3
Quiz
•
2nd Grade
10 questions
Area
Quiz
•
3rd Grade
17 questions
Fractions Review
Quiz
•
3rd Grade