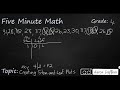
Creating and Analyzing Stem-and-Leaf Plots
Interactive Video
•
Mathematics
•
1st - 5th Grade
•
Practice Problem
•
Hard
Standards-aligned

Jackson Turner
FREE Resource
Standards-aligned
Read more
10 questions
Show all answers
1.
MULTIPLE CHOICE QUESTION
30 sec • 1 pt
What is the primary purpose of a stem-and-leaf plot?
To calculate averages
To display data distribution
To solve equations
To measure angles
2.
MULTIPLE CHOICE QUESTION
30 sec • 1 pt
In a stem-and-leaf plot, what does the 'stem' typically represent?
Units place
Hundreds place
Tens place
Decimal values
3.
MULTIPLE CHOICE QUESTION
30 sec • 1 pt
What does the 'leaf' in a stem-and-leaf plot typically represent?
Hundreds place
Decimal values
Units place
Tens place
4.
MULTIPLE CHOICE QUESTION
30 sec • 1 pt
If a stem-and-leaf plot shows '1 | 4 4', what numbers does this represent?
14 and 4
144
14 and 14
1 and 44
5.
MULTIPLE CHOICE QUESTION
30 sec • 1 pt
How should numbers be aligned in a stem-and-leaf plot?
Diagonally
Horizontally
Randomly
Vertically
6.
MULTIPLE CHOICE QUESTION
30 sec • 1 pt
What does the number '2 | 3' represent in a stem-and-leaf plot?
2.3
33
23
203
7.
MULTIPLE CHOICE QUESTION
30 sec • 1 pt
How many numbers are in the twenties band in the discussed stem-and-leaf plot?
Five
Three
Four
Six
Access all questions and much more by creating a free account
Create resources
Host any resource
Get auto-graded reports
Continue with Google

Continue with Email
Continue with Classlink
Continue with Clever
or continue with
Microsoft
%20(1).png)
Apple
Others
Already have an account?
Similar Resources on Wayground

8 questions
Estimating Fraction Sums and Differences with Benchmark Fractions
Interactive video
•
1st - 6th Grade
11 questions
Probability Concepts and Applications
Interactive video
•
1st - 5th Grade
11 questions
Exploring First Grade Addition and Subtraction
Interactive video
•
1st - 5th Grade
11 questions
Exploring Multiplication through Arrays and Repeated Addition
Interactive video
•
1st - 5th Grade
11 questions
Mastering Order of Operations and Exponents
Interactive video
•
1st - 5th Grade
11 questions
Understanding Related Facts and Fact Families
Interactive video
•
2nd - 4th Grade
6 questions
Music and Duration Analysis
Interactive video
•
1st - 6th Grade
Popular Resources on Wayground
8 questions
Spartan Way - Classroom Responsible
Quiz
•
9th - 12th Grade
15 questions
Fractions on a Number Line
Quiz
•
3rd Grade
14 questions
Boundaries & Healthy Relationships
Lesson
•
6th - 8th Grade
20 questions
Equivalent Fractions
Quiz
•
3rd Grade
3 questions
Integrity and Your Health
Lesson
•
6th - 8th Grade
25 questions
Multiplication Facts
Quiz
•
5th Grade
9 questions
FOREST Perception
Lesson
•
KG
20 questions
Main Idea and Details
Quiz
•
5th Grade
Discover more resources for Mathematics
15 questions
Fractions on a Number Line
Quiz
•
3rd Grade
20 questions
Equivalent Fractions
Quiz
•
3rd Grade
25 questions
Multiplication Facts
Quiz
•
5th Grade
15 questions
Equivalent Fractions
Quiz
•
4th Grade
18 questions
Comparing Fractions with same numerator or denominator
Quiz
•
3rd Grade
10 questions
Wayground Quiz Review for G2 Benchmark 3
Quiz
•
2nd Grade
10 questions
Area
Quiz
•
3rd Grade
17 questions
Fractions Review
Quiz
•
3rd Grade