- Resource Library
- Math
- Data And Graphing
- Data Representation
- Exploring Data Representation With Line And Mystery Plots
Exploring Data Representation with Line and Mystery Plots
Interactive Video
•
Mathematics
•
1st - 5th Grade
•
Practice Problem
•
Hard
+4
Standards-aligned

Emma Peterson
FREE Resource
Standards-aligned
10 questions
Show all answers
1.
MULTIPLE CHOICE QUESTION
30 sec • 1 pt
What type of graph is best suited for representing data on a number line?
Pie chart
Line plot
Circle graph
Bar graph
2.
MULTIPLE CHOICE QUESTION
30 sec • 1 pt
Which graph type is typically used to show proportions of a whole?
Line graph
Scatter plot
Bar graph
Circle graph
3.
MULTIPLE CHOICE QUESTION
30 sec • 1 pt
Which of the following is not a type of plot or graph mentioned in the introduction?
Bar graph
Line graph
Scatter plot
Circle graph
4.
MULTIPLE CHOICE QUESTION
30 sec • 1 pt
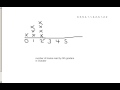
How many books did the majority of students read according to the line plot example?
Two books
Three books
Five books
One book
Tags
CCSS.2.MD.D.9
CCSS.3.MD.B.4
5.
MULTIPLE CHOICE QUESTION
30 sec • 1 pt
What is the maximum number of books read by a student in the example given?
Five
Six
Four
Three
Tags
CCSS.1.MD.C.4
6.
MULTIPLE CHOICE QUESTION
30 sec • 1 pt
What does a mystery line plot lack that a regular line plot has?
X's above numbers
Data points
Title or heading
Number line
Tags
CCSS.2.MD.D.9
7.
MULTIPLE CHOICE QUESTION
30 sec • 1 pt
In the pets example, how many households had exactly two pets?
Five households
Three households
Six households
Four households
Tags
CCSS.1.MD.C.4
Access all questions and much more by creating a free account
Create resources
Host any resource
Get auto-graded reports
Continue with Google

Continue with Email
Continue with Classlink
Continue with Clever
or continue with
Microsoft
%20(1).png)
Apple
Others
Already have an account?
