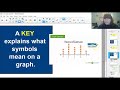
Understanding Graphs and Line Plots
Interactive Video
•
Mathematics, Education
•
4th - 5th Grade
•
Practice Problem
•
Hard

Sophia Harris
FREE Resource
Read more
10 questions
Show all answers
1.
MULTIPLE CHOICE QUESTION
30 sec • 1 pt
What is a line plot used for?
Displaying data on a number line with symbols for frequency
Showing changes over time with connected lines
Comparing large numbers with bars
Representing data with pictures
2.
MULTIPLE CHOICE QUESTION
30 sec • 1 pt
In a line plot, if each X represents two students, how many students are represented by three Xs?
Six students
Nine students
Three students
Twelve students
3.
MULTIPLE CHOICE QUESTION
30 sec • 1 pt
Which type of graph is best for comparing large numbers?
Line plot
Picture graph
Bar graph
Pie chart
4.
MULTIPLE CHOICE QUESTION
30 sec • 1 pt
When should you use a picture graph?
When data is small and in multiples of a number
When data is in large numbers
When data needs to be displayed on a number line
When data changes over time
5.
MULTIPLE CHOICE QUESTION
30 sec • 1 pt
What type of graph should be used to show how data changes over time?
Histogram
Bar graph
Line graph
Picture graph
6.
MULTIPLE CHOICE QUESTION
30 sec • 1 pt
If a star in a picture graph represents three visitors, how many stars would represent 15 visitors?
Three stars
Two stars
Five stars
Four stars
7.
MULTIPLE CHOICE QUESTION
30 sec • 1 pt
Which graph type is most suitable for showing the number of books read by students if the numbers are small and multiples of four?
Scatter plot
Picture graph
Bar graph
Line graph
Access all questions and much more by creating a free account
Create resources
Host any resource
Get auto-graded reports
Continue with Google

Continue with Email
Continue with Classlink
Continue with Clever
or continue with
Microsoft
%20(1).png)
Apple
Others
Already have an account?
