Reading and Analyzing Histograms
Interactive Video
•
Mathematics
•
6th - 8th Grade
•
Practice Problem
•
Hard
Standards-aligned

Lucas Foster
FREE Resource
Standards-aligned
10 questions
Show all answers
1.
MULTIPLE CHOICE QUESTION
30 sec • 1 pt
What is the primary purpose of using histograms in the video?
To compare different hospitals
To analyze survey data about nurses' years of experience
To study medication effects
To schedule nurse shifts
Tags
CCSS.6.SP.B.4
CCSS.HSS.ID.A.1
2.
MULTIPLE CHOICE QUESTION
30 sec • 1 pt
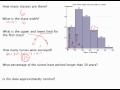
How many classes are represented in the histogram?
8
7
6
5
Tags
CCSS.6.SP.B.4
CCSS.HSS.ID.A.1
3.
MULTIPLE CHOICE QUESTION
30 sec • 1 pt
What is the class width of each interval in the histogram?
5 years
10 years
15 years
20 years
Tags
CCSS.6.SP.B.4
CCSS.HSS.ID.A.1
4.
MULTIPLE CHOICE QUESTION
30 sec • 1 pt
Which range of years does the first class in the histogram cover?
1-10 years
0-10 years
1-9 years
0-9 years
Tags
CCSS.6.SP.B.4
CCSS.HSS.ID.A.1
5.
MULTIPLE CHOICE QUESTION
30 sec • 1 pt
What does the upper limit of the first class represent?
None of the above
The average value
The minimum value included
The maximum value included
Tags
CCSS.6.SP.B.4
CCSS.HSS.ID.A.1
6.
MULTIPLE CHOICE QUESTION
30 sec • 1 pt
What is the significance of not including the upper limit value in each class?
To simplify calculations
To decrease the total number of classes
To increase the class width
To avoid duplication of values in classes
Tags
CCSS.6.SP.B.5A
7.
MULTIPLE CHOICE QUESTION
30 sec • 1 pt
How many nurses were surveyed according to the histogram?
135
115
105
125
Tags
CCSS.6.SP.B.5A
Access all questions and much more by creating a free account
Create resources
Host any resource
Get auto-graded reports
Continue with Google

Continue with Email
Continue with Classlink
Continue with Clever
or continue with
Microsoft
%20(1).png)
Apple
Others
Already have an account?
