Understanding Histograms and Shark Data
Interactive Video
•
Mathematics, Biology, Science
•
6th - 8th Grade
•
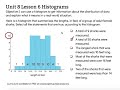
Practice Problem
•
Hard

Thomas White
FREE Resource
Read more
10 questions
Show all answers
1.
MULTIPLE CHOICE QUESTION
30 sec • 1 pt
What is the primary purpose of a histogram?
To highlight trends over time
To compare different categories
To show the distribution of data across ranges
To display individual data points
2.
MULTIPLE CHOICE QUESTION
30 sec • 1 pt
How are the bars in a histogram typically arranged?
Right next to each other without spaces
With spaces between them
In ascending order
In descending order
3.
MULTIPLE CHOICE QUESTION
30 sec • 1 pt
What does the x-axis in a histogram represent?
The frequency of data points
The average of data values
The range of data values
The total number of data points
4.
MULTIPLE CHOICE QUESTION
30 sec • 1 pt
In the shark lengths histogram, what does each rectangle represent?
The total number of sharks
The average length of sharks
A range of shark lengths
An individual shark
5.
MULTIPLE CHOICE QUESTION
30 sec • 1 pt
How many sharks were measured in total according to the histogram?
Nine
Fifty
Ten
Twenty
6.
MULTIPLE CHOICE QUESTION
30 sec • 1 pt
What is incorrect about the statement that the longest shark was ten feet long?
The longest shark was eight feet
The longest shark was actually twelve feet
The ten represents the number of sharks, not length
The ten represents the average length
7.
MULTIPLE CHOICE QUESTION
30 sec • 1 pt
How many sharks were over 16 feet long?
Twenty
Ten
Five
Fifteen
Access all questions and much more by creating a free account
Create resources
Host any resource
Get auto-graded reports
Continue with Google

Continue with Email
Continue with Classlink
Continue with Clever
or continue with
Microsoft
%20(1).png)
Apple
Others
Already have an account?
