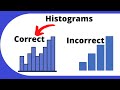
Interpreting and Creating Histograms
Interactive Video
•
Mathematics
•
6th - 8th Grade
•
Practice Problem
•
Medium
+2
Standards-aligned

Lucas Foster
Used 58+ times
FREE Resource
Standards-aligned
Read more
10 questions
Show all answers
1.
MULTIPLE CHOICE QUESTION
30 sec • 1 pt
What is a histogram primarily used for?
To compare different datasets
To show frequency of data ranges
To plot qualitative data
To calculate the mean of data
Tags
CCSS.6.SP.B.4
CCSS.HSS.ID.A.1
2.
MULTIPLE CHOICE QUESTION
30 sec • 1 pt
What does the x-axis typically represent in a histogram?
Total number of observations
Percentage of total data
Frequency of data
Data intervals
Tags
CCSS.6.SP.B.4
CCSS.HSS.ID.A.1
3.
MULTIPLE CHOICE QUESTION
30 sec • 1 pt
In the provided histogram example, which time interval had the most student responses?
20 to 29 minutes
30 to 39 minutes
50 to 59 minutes
40 to 49 minutes
Tags
CCSS.2.MD.D.9
CCSS.3.MD.B.4
4.
MULTIPLE CHOICE QUESTION
30 sec • 1 pt
How many students were surveyed in the histogram example?
20 students
12 students
15 students
10 students
Tags
CCSS.2.MD.D.9
5.
MULTIPLE CHOICE QUESTION
30 sec • 1 pt
What is the first step in constructing a histogram?
Collecting the data
Drawing the bars
Creating a frequency table
Labeling the axes
Tags
CCSS.6.SP.B.4
CCSS.HSS.ID.A.1
6.
MULTIPLE CHOICE QUESTION
30 sec • 1 pt
Which interval should be used for amounts from $20 to $30?
$20 to $29.99
$20 to $30
$19.99 to $29.99
$20 to $30.99
Tags
CCSS.6.SP.B.4
CCSS.HSS.ID.A.1
7.
MULTIPLE CHOICE QUESTION
30 sec • 1 pt
What is the highest frequency of money spent in the given data?
Four customers
Five customers
Two customers
Three customers
Tags
CCSS.2.MD.D.10
Access all questions and much more by creating a free account
Create resources
Host any resource
Get auto-graded reports
Continue with Google

Continue with Email
Continue with Classlink
Continue with Clever
or continue with
Microsoft
%20(1).png)
Apple
Others
Already have an account?
