Exploring Scatter Plots and Trend Lines
Interactive Video
•
Mathematics
•
6th - 8th Grade
•
Practice Problem
•
Hard
+1
Standards-aligned

Jackson Turner
FREE Resource
Standards-aligned
Read more
10 questions
Show all answers
1.
MULTIPLE CHOICE QUESTION
30 sec • 1 pt
What does a scatter plot typically display?
Circular data points
Bars of varying heights
Points scattered without specific alignment
Points arranged in a straight line
2.
MULTIPLE CHOICE QUESTION
30 sec • 1 pt
What term describes the general pattern of points in a scatter plot?
Frequency
Correlation
Gradient
Intercept
Tags
CCSS.HSS.ID.B.5
3.
MULTIPLE CHOICE QUESTION
30 sec • 1 pt
What type of correlation is depicted when data points trend upwards?
Positive correlation
Negative correlation
No correlation
Neutral correlation
Tags
CCSS.HSS.ID.B.5
4.
MULTIPLE CHOICE QUESTION
30 sec • 1 pt
If scatter plot data points show no clear pattern, what type of correlation is it?
Positive correlation
Negative correlation
No correlation
Linear correlation
Tags
CCSS.HSF-LE.A.1B
5.
MULTIPLE CHOICE QUESTION
30 sec • 1 pt
In the context of scatter plots, what does 'no correlation' imply about the data points?
They cluster around the mean
They are randomly distributed
They form a straight line
They form a perfect curve
Tags
CCSS.HSS.ID.B.5
6.
MULTIPLE CHOICE QUESTION
30 sec • 1 pt
What is the purpose of a trend line in a scatter plot?
To show the data's trend
To predict future values
To calculate the mean
To connect all data points
Tags
CCSS.8.SP.A.2
7.
MULTIPLE CHOICE QUESTION
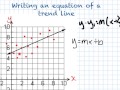
30 sec • 1 pt
Which form is used to write the equation of a trend line when the y-intercept is not clear?
Point-slope form
Standard form
Quadratic form
Slope-intercept form
Access all questions and much more by creating a free account
Create resources
Host any resource
Get auto-graded reports
Continue with Google

Continue with Email
Continue with Classlink
Continue with Clever
or continue with
Microsoft
%20(1).png)
Apple
Others
Already have an account?
