Exploring Line Plots in Lesson 9.1
Interactive Video
•
Mathematics
•
6th - 10th Grade
•
Practice Problem
•
Hard
+5
Standards-aligned

Ethan Morris
FREE Resource
Standards-aligned
10 questions
Show all answers
1.
MULTIPLE CHOICE QUESTION
30 sec • 1 pt
What is a line plot used for in data representation?
To measure the exact weight of objects
To calculate complex equations
To visually represent and organize data
To write down numerical data without visualization
Tags
CCSS.3.MD.B.4
2.
MULTIPLE CHOICE QUESTION
30 sec • 1 pt
How many 1/4 pound bags of trail mix were there?
5 bags
3 bags
6 bags
4 bags
Tags
CCSS.5.NF.B.7B
CCSS.5.NF.B.7C
3.
MULTIPLE CHOICE QUESTION
30 sec • 1 pt
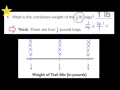
What is the combined weight of the 1/2 pound bags?
2.5 pounds
2 pounds
1.5 pounds
1 pound
Tags
CCSS.4.MD.A.2
4.
MULTIPLE CHOICE QUESTION
30 sec • 1 pt
How many 3/4 pound bags of trail mix were counted?
5
4
3
2
Tags
CCSS.3.NF.A.1
CCSS.3.NF.A.2B
5.
MULTIPLE CHOICE QUESTION
30 sec • 1 pt
What is the total weight of all the trail mix bags combined?
7 pounds
6 pounds
5 pounds
8 pounds
Tags
CCSS.3.MD.A.2
6.
MULTIPLE CHOICE QUESTION
30 sec • 1 pt
How is the total weight of the trail mix used in all bags calculated?
By dividing the total number of bags by the average weight
By multiplying the number of bags by the average weight
By adding the combined weight of each type of bag
By counting the number of bags
Tags
CCSS.3.MD.A.2
7.
MULTIPLE CHOICE QUESTION
30 sec • 1 pt
What is the first step in finding the average amount of trail mix per bag?
Divide the total weight by the number of bags
Multiply the weights of all bags
Add the weights of all bags
Subtract the smallest bag's weight from the total weight
Tags
CCSS.4.MD.A.2
Access all questions and much more by creating a free account
Create resources
Host any resource
Get auto-graded reports
Continue with Google

Continue with Email
Continue with Classlink
Continue with Clever
or continue with
Microsoft
%20(1).png)
Apple
Others
Already have an account?
