Exploring Pictographs and Bar Graphs in Grade 3 Math
Interactive Video
•
Mathematics
•
6th - 10th Grade
•
Practice Problem
•
Hard
+3
Standards-aligned

Lucas Foster
FREE Resource
Standards-aligned
Read more
10 questions
Show all answers
1.
MULTIPLE CHOICE QUESTION
30 sec • 1 pt
What is the purpose of using pictographs and bar graphs in data interpretation?
To confuse the audience with complex representations
To only display data without interpretation
To make it harder to understand data
To organize and make sense of collected data
Tags
CCSS.2.MD.D.10
2.
MULTIPLE CHOICE QUESTION
30 sec • 1 pt
What does a pictograph use to represent information?
Bars
Pictures
Letters
Numbers only
Tags
CCSS.2.MD.D.10
3.
MULTIPLE CHOICE QUESTION
30 sec • 1 pt
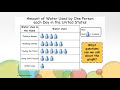
How many gallons of water does each picture represent in the pictograph discussed?
One gallon
Four gallons
Two gallons
Three gallons
Tags
CCSS.3.MD.B.4
4.
MULTIPLE CHOICE QUESTION
30 sec • 1 pt
Which activity uses the most water according to the data?
Washing clothes
Using sink faucets
Flushing the toilet
Taking a shower
Tags
CCSS.3.MD.A.2
5.
MULTIPLE CHOICE QUESTION
30 sec • 1 pt
Which of the following is true about the data presented in the pictograph?
Flushing the toilet uses 18 gallons of water a day for one person
Washing clothes uses less water than using sink faucets
Taking a shower is the activity that uses the least water
Other uses of water exceed all other categories combined
Tags
CCSS.2.MD.D.9
6.
MULTIPLE CHOICE QUESTION
30 sec • 1 pt
What axis is labeled with 'Water Uses in the Home' in the bar graph?
X-axis
Y-axis
Both X and Y-axis
Neither X nor Y-axis
Tags
CCSS.3.MD.B.3
7.
MULTIPLE CHOICE QUESTION
30 sec • 1 pt
What is missing from the bar graph that needs to be added for clarity?
A key
The title
Gallons measurement
Pictures
Tags
CCSS.3.MD.B.4
Access all questions and much more by creating a free account
Create resources
Host any resource
Get auto-graded reports
Continue with Google

Continue with Email
Continue with Classlink
Continue with Clever
or continue with
Microsoft
%20(1).png)
Apple
Others
Already have an account?
