Exploring Scatterplots and Predictions
Interactive Video
•
Mathematics
•
6th - 10th Grade
•
Practice Problem
•
Hard
+1
Standards-aligned

Emma Peterson
FREE Resource
Standards-aligned
6 questions
Show all answers
1.
MULTIPLE CHOICE QUESTION
30 sec • 1 pt
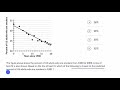
What does the figure above show?
The percent of U.S. adults who are non-smokers from 1980 to 2000.
The percent of U.S. children who are smokers from 1980 to 2000.
The percent of U.S. adults who are smokers from 1980 to 2000.
The percent of U.S. adults who are smokers from 1990 to 2010.
Tags
CCSS.HSF.LE.B.5
2.
MULTIPLE CHOICE QUESTION
30 sec • 1 pt
What additional information is provided in the figure?
A table listing the number of smokers each year.
A pie chart showing the distribution of smokers by age.
A bar graph showing the number of smokers each year.
A line of best fit.
3.
MULTIPLE CHOICE QUESTION
30 sec • 1 pt
What is the task based on the line of best fit?
To find the closest predicted percent of U.S. adults who are smokers in 1981.
To find the percent of non-smokers in 1981.
To find the exact percent of smokers in 1981.
To find the percent of smokers in 2000.
4.
MULTIPLE CHOICE QUESTION
30 sec • 1 pt
How many years since 1980 is 1981?
Three years.
Four years.
Two years.
One year.
Tags
CCSS.6.EE.A.2C
5.
MULTIPLE CHOICE QUESTION
30 sec • 1 pt
Where would 1981 be located on the graph?
One year since 1980.
At the end of the graph.
Two years since 1980.
At the beginning of the graph.
Tags
CCSS.HSF-IF.C.7E
6.
MULTIPLE CHOICE QUESTION
30 sec • 1 pt
What is the closest predicted percent of U.S. adults who are smokers in 1981?
30%
31%
32%
33%
Tags
CCSS.HSF.IF.B.4
Access all questions and much more by creating a free account
Create resources
Host any resource
Get auto-graded reports
Continue with Google

Continue with Email
Continue with Classlink
Continue with Clever
or continue with
Microsoft
%20(1).png)
Apple
Others
Already have an account?
