Understanding Confidence Intervals in Statistics
Interactive Video
•
Mathematics
•
9th - 10th Grade
•
Hard

Thomas White
FREE Resource
Read more
48 questions
Show all answers
1.
MULTIPLE CHOICE QUESTION
30 sec • 1 pt
What is the primary focus of this lesson?
Studying probability distributions
Exploring hypothesis testing
Understanding standard deviation
Learning about confidence intervals for single population proportion
2.
MULTIPLE CHOICE QUESTION
30 sec • 1 pt
What does 'P' represent in the context of this lesson?
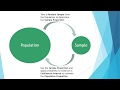
Population proportion
Population mean
Sample mean
Sample proportion
3.
MULTIPLE CHOICE QUESTION
30 sec • 1 pt
What is the formula for standard deviation in this context?
Square root of N times P
P times 1 minus P over N
Square root of P times 1 minus P over N
N times P over 1 minus P
4.
MULTIPLE CHOICE QUESTION
30 sec • 1 pt
What is the significance of 'n times P' being greater than or equal to 10?
It confirms the sample is random
It verifies the number of successes
It ensures the sample size is large enough
It checks the number of failures
5.
MULTIPLE CHOICE QUESTION
30 sec • 1 pt
What is a population parameter?
A characteristic of a sample
A measurement from a population
A type of probability distribution
A statistical test
6.
MULTIPLE CHOICE QUESTION
30 sec • 1 pt
What is a confidence interval?
A statistical test for hypothesis
A method to calculate standard deviation
A point estimate plus or minus a margin of error
A range of values for a sample mean
7.
MULTIPLE CHOICE QUESTION
30 sec • 1 pt
What does 'P hat' represent?
Population mean
Population proportion
Sample proportion
Sample mean
Access all questions and much more by creating a free account
Create resources
Host any resource
Get auto-graded reports
Continue with Google

Continue with Email
Continue with Classlink
Continue with Clever
or continue with
Microsoft
%20(1).png)
Apple
Others
Already have an account?
