Understanding Picture and Bar Graphs
Interactive Video
•
Mathematics
•
3rd - 4th Grade
•
Hard

Thomas White
FREE Resource
Read more
15 questions
Show all answers
1.
MULTIPLE CHOICE QUESTION
30 sec • 1 pt
What method did JT use to collect data about his class's favorite colors?
An interview
A focus group
A questionnaire
A survey
2.
MULTIPLE CHOICE QUESTION
30 sec • 1 pt
What tool did JT use to initially record the data from his survey?
A tally chart
A pie chart
A line graph
A spreadsheet
3.
MULTIPLE CHOICE QUESTION
30 sec • 1 pt
What is a key feature of picture graphs mentioned by JT?
They use bars to represent data
They use pictures to represent data
They use numbers to represent data
They use lines to represent data
4.
MULTIPLE CHOICE QUESTION
30 sec • 1 pt
How does JT ensure everyone understands the symbols in his picture graph?
By using a key
By using a description
By using a legend
By using a title
5.
MULTIPLE CHOICE QUESTION
30 sec • 1 pt
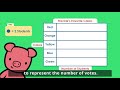
How many votes does one circle represent in JT's picture graph?
One vote
Two votes
Three votes
Four votes
6.
MULTIPLE CHOICE QUESTION
30 sec • 1 pt
What does JT do to represent a single vote for green in his picture graph?
Draws a full circle
Draws a half circle
Draws a square
Draws a triangle
7.
MULTIPLE CHOICE QUESTION
30 sec • 1 pt
What is the orientation of a bar graph as explained by JT?
Circular
Vertical
Horizontal
Diagonal
Access all questions and much more by creating a free account
Create resources
Host any resource
Get auto-graded reports
Continue with Google

Continue with Email
Continue with Classlink
Continue with Clever
or continue with
Microsoft
%20(1).png)
Apple
Others
Already have an account?
