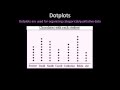
Understanding Dot Plots and Dice Rolls
Interactive Video
•
Mathematics
•
5th - 6th Grade
•
Practice Problem
•
Hard

Thomas White
FREE Resource
Read more
15 questions
Show all answers
1.
MULTIPLE CHOICE QUESTION
30 sec • 1 pt
What type of data are dot plots typically used for?
Categorical or qualitative data
Quantitative data
Time series data
Geographical data
2.
MULTIPLE CHOICE QUESTION
30 sec • 1 pt
In the chocolate example, what does each dot represent?
A student
A piece of chocolate
A classroom
A type of candy
3.
MULTIPLE CHOICE QUESTION
30 sec • 1 pt
How many pieces of chocolate does Suzanne have according to the dot plot?
Four
Eight
Nine
Six
4.
MULTIPLE CHOICE QUESTION
30 sec • 1 pt
What is the key concept that dots in a dot plot represent?
The frequency of each result
The size of the data set
The range of data
The average value
5.
MULTIPLE CHOICE QUESTION
30 sec • 1 pt
When creating a dot plot, what does the frequency indicate?
The total number of observations
The average of the data
The number of times an observation occurs
The number of categories
6.
MULTIPLE CHOICE QUESTION
30 sec • 1 pt
How many times was the sum of three rolled in the dice example?
Once
Twice
Three times
Four times
7.
MULTIPLE CHOICE QUESTION
30 sec • 1 pt
What is the frequency of the sum of seven in the dice roll example?
Eleven times
Four times
Six times
Nine times
Access all questions and much more by creating a free account
Create resources
Host any resource
Get auto-graded reports
Continue with Google

Continue with Email
Continue with Classlink
Continue with Clever
or continue with
Microsoft
%20(1).png)
Apple
Others
Already have an account?
