Understanding Correlation and Scatter Plots
Interactive Video
•
Mathematics
•
9th - 10th Grade
•
Practice Problem
•
Hard

Amelia Wright
FREE Resource
Read more
10 questions
Show all answers
1.
MULTIPLE CHOICE QUESTION
30 sec • 1 pt
What is the purpose of a line of best fit in a scatter plot?
To highlight the highest and lowest points
To separate the data into two groups
To connect all the data points
To show the average trend of the data
2.
MULTIPLE CHOICE QUESTION
30 sec • 1 pt
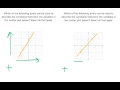
In the first scatter plot, what happens to the Y values as X increases?
Y values fluctuate randomly
Y values increase
Y values remain constant
Y values decrease
3.
MULTIPLE CHOICE QUESTION
30 sec • 1 pt
What type of correlation is shown in the first scatter plot?
Inverse correlation
No correlation
Negative correlation
Positive correlation
4.
MULTIPLE CHOICE QUESTION
30 sec • 1 pt
How does the line of best fit in the second scatter plot compare to the first?
It has a negative slope
It is vertical
It has a positive slope
It is horizontal
5.
MULTIPLE CHOICE QUESTION
30 sec • 1 pt
What is a negative correlation?
X and Y both decrease
X and Y are unrelated
As X increases, Y decreases
As X increases, Y increases
6.
MULTIPLE CHOICE QUESTION
30 sec • 1 pt
What indicates a strong correlation in a scatter plot?
Points form a perfect circle
Points are randomly scattered
Points are close to the line
Points are far from the line
7.
MULTIPLE CHOICE QUESTION
30 sec • 1 pt
How would you describe the correlation in the first scatter plot?
Negative correlation
Weak positive correlation
Strong positive correlation
No correlation
Access all questions and much more by creating a free account
Create resources
Host any resource
Get auto-graded reports
Continue with Google

Continue with Email
Continue with Classlink
Continue with Clever
or continue with
Microsoft
%20(1).png)
Apple
Others
Already have an account?
Similar Resources on Wayground

10 questions
Comparing Integers with Inequalities
Interactive video
•
6th - 10th Grade
15 questions
Othello Character Motivations and Actions
Interactive video
•
9th - 10th Grade
11 questions
Inductive and Deductive Reasoning in Geometry
Interactive video
•
6th - 10th Grade
6 questions
Understanding Ionic Compounds
Interactive video
•
9th - 10th Grade
6 questions
Understanding Atomic Bonding
Interactive video
•
9th - 10th Grade
11 questions
Ellis Island Historical Insights
Interactive video
•
9th - 12th Grade
11 questions
Understanding Reactivity and Shielding in the Periodic Table
Interactive video
•
9th - 12th Grade
11 questions
Figurative Language and Symbolism Insights
Interactive video
•
9th - 12th Grade
Popular Resources on Wayground
8 questions
Spartan Way - Classroom Responsible
Quiz
•
9th - 12th Grade
15 questions
Fractions on a Number Line
Quiz
•
3rd Grade
14 questions
Boundaries & Healthy Relationships
Lesson
•
6th - 8th Grade
20 questions
Equivalent Fractions
Quiz
•
3rd Grade
3 questions
Integrity and Your Health
Lesson
•
6th - 8th Grade
25 questions
Multiplication Facts
Quiz
•
5th Grade
9 questions
FOREST Perception
Lesson
•
KG
20 questions
Main Idea and Details
Quiz
•
5th Grade
Discover more resources for Mathematics
20 questions
Graphing Inequalities on a Number Line
Quiz
•
6th - 9th Grade
11 questions
Adding and Subtracting Polynomials
Quiz
•
9th Grade
20 questions
Box and Whisker Plots
Quiz
•
9th Grade
18 questions
Exponential Growth and Decay
Quiz
•
9th Grade
12 questions
Equation of a Circle
Lesson
•
10th Grade
12 questions
Exponential Growth and Decay
Quiz
•
9th Grade
14 questions
Making Inferences From Samples
Quiz
•
7th - 12th Grade
24 questions
Solving Linear Equations with Variables on Both Sides
Quiz
•
9th Grade