Solving/Interpreting Linear Inequalities in Two Variables
Authored by Anthony Clark
Mathematics
9th Grade
CCSS covered
Used 1+ times

AI Actions
Add similar questions
Adjust reading levels
Convert to real-world scenario
Translate activity
More...
Content View
Student View
15 questions
Show all answers
1.
MULTIPLE CHOICE QUESTION
1 min • 5 pts

Choose the correct inequality for this graph.
Tags
CCSS.HSA.REI.D.12
2.
MULTIPLE CHOICE QUESTION
1 min • 5 pts
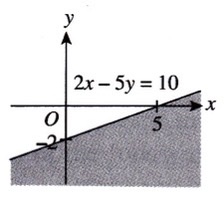
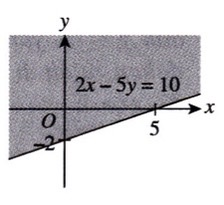
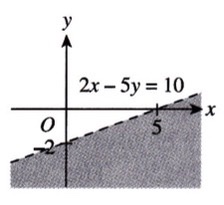
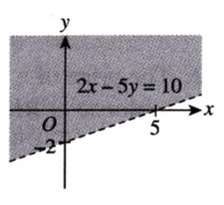
Which shaded region in the diagram is defined by the linear inequality 2x - 5y < 10 ?
Tags
CCSS.HSA.REI.D.12
3.
MULTIPLE CHOICE QUESTION
1 min • 5 pts

Write the inequality
y>2/3x-3
y<2/3x-3
y≤2/3x-3
y≥2/3x-3
Tags
CCSS.HSA.REI.D.12
4.
MULTIPLE CHOICE QUESTION
1 min • 5 pts

Write the inequalities
x≤-2
y≤x-3
y≤-2
y≤x-3
x≥-2
y≤x-3
y≥-2
y≤x-3
Tags
CCSS.HSA.REI.D.12
5.
MULTIPLE SELECT QUESTION
1 min • 5 pts

Identify the two inequalities that represents the graph.
y > ½x - 3
y ≤ -4x + 2
y < ½x - 3
y ≥ -4x + 2
Tags
CCSS.HSA.REI.D.12
6.
MULTIPLE CHOICE QUESTION
1 min • 5 pts

Diagram 2 shows two straight lines on a Cartesian plane. Which of the following regions define linear inequalities
y ≤ x + 5 and y ≥ 2 − x?
I
II
III
IV
Tags
CCSS.HSA.REI.D.12
7.
MULTIPLE CHOICE QUESTION
1 min • 5 pts

The diagram shows a shaded region that satisfies three inequalities. State an inequality other than x < 4 and y ≥ −x.
x ≤ o
x ≥ 0
y ≤ 0
y ≥ 0
Tags
CCSS.HSA.REI.D.12


Access all questions and much more by creating a free account
Create resources
Host any resource
Get auto-graded reports
Continue with Google

Continue with Email
Continue with Classlink
Continue with Clever
or continue with
Microsoft
%20(1).png)
Apple
Others
Already have an account?
Similar Resources on Wayground

15 questions
REPASO 2DO. TOMO III
Quiz
•
9th Grade
10 questions
TOÁN LỚP 2
Quiz
•
7th - 12th Grade
10 questions
MVC1 M2
Quiz
•
9th Grade
10 questions
ÁLGEBRA | NUM. Y OPER.
Quiz
•
12th Grade
10 questions
Repaso Unidad 1- Cálculo III - Com 520 - 2022
Quiz
•
University
10 questions
Basic Trigonometric Identities
Quiz
•
10th - 11th Grade
19 questions
Vektoren, Geraden und Ebenen
Quiz
•
10th - 12th Grade
15 questions
Standard Form
Quiz
•
9th Grade
Popular Resources on Wayground
15 questions
Fractions on a Number Line
Quiz
•
3rd Grade
20 questions
Equivalent Fractions
Quiz
•
3rd Grade
25 questions
Multiplication Facts
Quiz
•
5th Grade
29 questions
Alg. 1 Section 5.1 Coordinate Plane
Quiz
•
9th Grade
22 questions
fractions
Quiz
•
3rd Grade
11 questions
FOREST Effective communication
Lesson
•
KG
20 questions
Main Idea and Details
Quiz
•
5th Grade
20 questions
Context Clues
Quiz
•
6th Grade
Discover more resources for Mathematics
29 questions
Alg. 1 Section 5.1 Coordinate Plane
Quiz
•
9th Grade
20 questions
Graphing Inequalities on a Number Line
Quiz
•
6th - 9th Grade
20 questions
Box and Whisker Plots
Quiz
•
9th Grade
18 questions
Exponential Growth and Decay
Quiz
•
9th Grade
20 questions
Function or Not a Function
Quiz
•
8th - 9th Grade
20 questions
SSS/SAS
Quiz
•
9th - 12th Grade
14 questions
Making Inferences From Samples
Quiz
•
7th - 12th Grade
23 questions
CCG - CH8 Polygon angles and area Review
Quiz
•
9th - 12th Grade