Graphing and Transforming Absolute Value Functions
Authored by Anthony Clark
Mathematics
9th Grade
CCSS covered

AI Actions
Add similar questions
Adjust reading levels
Convert to real-world scenario
Translate activity
More...
Content View
Student View
10 questions
Show all answers
1.
MULTIPLE CHOICE QUESTION
1 min • 1 pt

The function
f(t) = -2|t - 15| + 50
is graphed and represents weekly sales of shoes, f(t) in $1000s, where t is weeks. What is the domain for this graph?
0 ≤ t ≤ 40
0 ≤ t ≤ ∞
20 ≤ t ≤ 40
-∞ ≤ t ≤ 50
Tags
CCSS.8.F.A.1
CCSS.HSF.IF.B.5
2.
MULTIPLE CHOICE QUESTION
1 min • 1 pt
The function
f(t) = -2|t - 15| + 50
is graphed and represents weekly sales of shoes, f(t) in $1000s, where t is weeks. What is the range for this graph?
20 ≤ f(t) ≤ 50
0 ≤ f(t) ≤ ∞
0 ≤ f(t) ≤ 50
-∞ ≤ f(t) ≤ 50
Tags
CCSS.HSF-IF.C.7D
3.
MULTIPLE CHOICE QUESTION
1 min • 1 pt

Which function is graphed?
f(x) = 2|x + 2| -4
f(x) = 2|x - 4| + 2
f(x) = |x + 2| - 4
f(x) = -2|x - 4|
Tags
CCSS.HSF-IF.C.7D
4.
MULTIPLE CHOICE QUESTION
1 min • 1 pt
The function f(t) = -2|t - 15| + 50 is graphed and represents weekly sales of shoes, f(t) in $1000s, where t is weeks. What is the maximum sales for one week?
$40,0000
$20,0000
$50,000
$10,0000
5.
MULTIPLE CHOICE QUESTION
1 min • 1 pt

Which function is graphed?
f(x) = 2|x - 5|
f(x) = |x - 5|
f(x) = |x - 5| + 5
f(x) = |x| + 5
6.
MULTIPLE CHOICE QUESTION
1 min • 1 pt

Which function is graphed?
f(x) = -3|-x + 1| + 4
f(x) = -|x - 1| + 4
f(x) = -5|x + 1| + 4
f(x) = -3|x - 4| + 1
7.
MULTIPLE CHOICE QUESTION
1 min • 1 pt
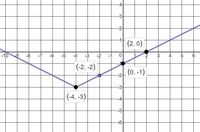
Which function is graphed?
f(x) = 2|x + 2| - 3
f(x) = |1/2x + 2| - 3
f(x) = |1/2x + 3| - 2
f(x) = 4|1/2x + 3| - 2
Tags
CCSS.HSF-IF.C.7D
Access all questions and much more by creating a free account
Create resources
Host any resource
Get auto-graded reports
Continue with Google

Continue with Email
Continue with Classlink
Continue with Clever
or continue with
Microsoft
%20(1).png)
Apple
Others
Already have an account?
Similar Resources on Wayground

10 questions
MGSE.7.G2 (Triangles)
Quiz
•
KG - University
10 questions
PENILAIAN TENGAH SEMESTER KELAS X
Quiz
•
10th Grade
10 questions
تحليل الدوال
Quiz
•
12th Grade
10 questions
Lũy thừa
Quiz
•
12th Grade
10 questions
الاحتمالات 2
Quiz
•
11th Grade
13 questions
Juego integrador de Matemática!
Quiz
•
University
10 questions
FACTORIZACIÓN
Quiz
•
11th Grade
10 questions
Equation of the circle
Quiz
•
10th Grade - University
Popular Resources on Wayground
8 questions
Spartan Way - Classroom Responsible
Quiz
•
9th - 12th Grade
15 questions
Fractions on a Number Line
Quiz
•
3rd Grade
14 questions
Boundaries & Healthy Relationships
Lesson
•
6th - 8th Grade
20 questions
Equivalent Fractions
Quiz
•
3rd Grade
3 questions
Integrity and Your Health
Lesson
•
6th - 8th Grade
25 questions
Multiplication Facts
Quiz
•
5th Grade
9 questions
FOREST Perception
Lesson
•
KG
20 questions
Main Idea and Details
Quiz
•
5th Grade
Discover more resources for Mathematics
20 questions
Graphing Inequalities on a Number Line
Quiz
•
6th - 9th Grade
11 questions
Adding and Subtracting Polynomials
Quiz
•
9th Grade
20 questions
Box and Whisker Plots
Quiz
•
9th Grade
18 questions
Exponential Growth and Decay
Quiz
•
9th Grade
12 questions
Exponential Growth and Decay
Quiz
•
9th Grade
14 questions
Making Inferences From Samples
Quiz
•
7th - 12th Grade
24 questions
Solving Linear Equations with Variables on Both Sides
Quiz
•
9th Grade
20 questions
Rational and Irrational Numbers, Perfect Squares, & Perfect Cube
Quiz
•
9th Grade