Rate Tables and Graphs
Authored by Anthony Clark
Mathematics
7th Grade
CCSS covered

AI Actions
Add similar questions
Adjust reading levels
Convert to real-world scenario
Translate activity
More...
Content View
Student View
10 questions
Show all answers
1.
MULTIPLE CHOICE QUESTION
1 min • 1 pt

Which statement is the correct unit rate?
5 seconds per foot
5 feet per second
2.5 seconds per foot
2.5 feet per second
Tags
CCSS.7.RP.A.2D
2.
MULTIPLE CHOICE QUESTION
1 min • 1 pt

Based on the graph, explain the unit rate.
The unit rate is 125
The unit rate is 1
Not here
Tags
CCSS.7.RP.A.2D
3.
MULTIPLE CHOICE QUESTION
1 min • 1 pt
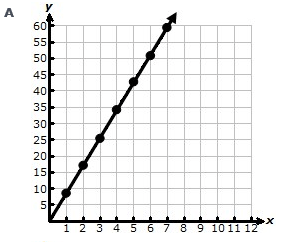
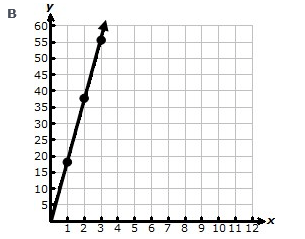
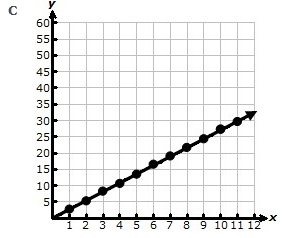
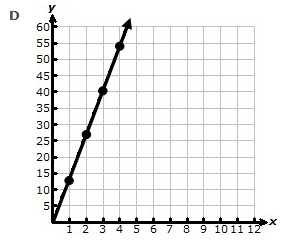
Carter receives $13.50 for every 5 boxes of chocolate he sells. Which graph shows this relationship?
Tags
CCSS.8.EE.B.5
4.
MULTIPLE CHOICE QUESTION
1 min • 1 pt

Which graph shows the same unit rate?


Tags
CCSS.7.RP.A.2D
5.
MULTIPLE CHOICE QUESTION
1 min • 1 pt
Joel earns $4.50 per hour. Which graph represents this relationship?


Tags
CCSS.8.EE.B.5
6.
MULTIPLE CHOICE QUESTION
1 min • 1 pt
For every 125 pages Daysha reads, she earns 5 points. Which graph models this relationship?
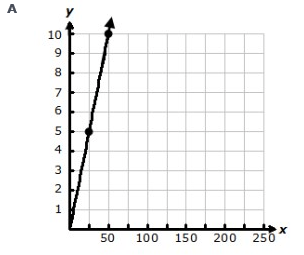
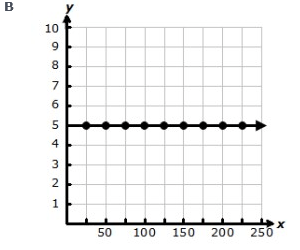
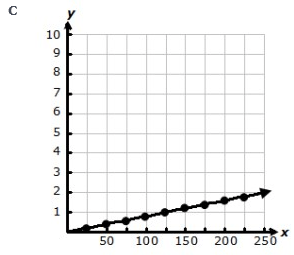

Tags
CCSS.8.EE.B.5
7.
MULTIPLE CHOICE QUESTION
1 min • 5 pts

Write the equation for the table.
y = x + 4
y = 5x
y = 4x + 1
y = x + 5
Tags
CCSS.6.EE.C.9


Access all questions and much more by creating a free account
Create resources
Host any resource
Get auto-graded reports
Continue with Google

Continue with Email
Continue with Classlink
Continue with Clever
or continue with
Microsoft
%20(1).png)
Apple
Others
Already have an account?
