Charts Tables and Graphs
Quiz
•
Science
•
8th - 10th Grade
•
Practice Problem
•
Medium
+12
Standards-aligned
Michelle Rushing
Used 21+ times
FREE Resource
Enhance your content in a minute
35 questions
Show all answers
1.
MULTIPLE CHOICE QUESTION
30 sec • 1 pt

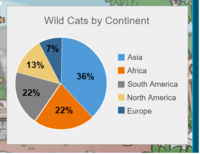
Which continent has 36% of the wild cats?
Asia
Africa
North America
South America
Tags
NGSS.MS-LS2-1
2.
MULTIPLE CHOICE QUESTION
3 mins • 1 pt
Type of graph that shows changes in quantities over time and distance.
Tags
NGSS.MS-PS3-1
3.
MULTIPLE CHOICE QUESTION
3 mins • 1 pt
Type of graph that shows parts of a whole; the proportional relationship of one set of values.
4.
MULTIPLE CHOICE QUESTION
3 mins • 1 pt
The horizontal axis; usually for categories.
Tags
CCSS.5.G.A.1
5.
MULTIPLE CHOICE QUESTION
3 mins • 1 pt
The vertical axis; usually for values.
Tags
CCSS.5.G.A.1
6.
MULTIPLE CHOICE QUESTION
30 sec • 1 pt

Which continent has 13% of wild cats?
Asia
Africa
North America
South America
7.
MULTIPLE CHOICE QUESTION
1 min • 1 pt
What percentage does a whole pie chart represent?
360%
90%
50%
100%
Create a free account and access millions of resources
Create resources
Host any resource
Get auto-graded reports

Continue with Google

Continue with Email

Continue with Classlink

Continue with Clever
or continue with

Microsoft
%20(1).png)
Apple
Others
By signing up, you agree to our Terms of Service & Privacy Policy
Already have an account?
Similar Resources on Wayground

30 questions
Q1 REVIEW
Quiz
•
9th Grade

32 questions
Distance and Displacement
Quiz
•
8th - 9th Grade

39 questions
Urbanization
Quiz
•
9th Grade

32 questions
Mid Term Review
Quiz
•
9th Grade

31 questions
Unit 1 Exam (E.S.)
Quiz
•
10th - 12th Grade

30 questions
01-11-2021 Year 9 Chemistry Quiz 2 KS3 C1 Part 2
Quiz
•
6th - 10th Grade

30 questions
Apparato digerente
Quiz
•
6th - 8th Grade

30 questions
01-11-2021 Year 11 Chemistry Quiz 2- C6 Electrolysis
Quiz
•
9th - 10th Grade
Popular Resources on Wayground

10 questions
Honoring the Significance of Veterans Day
Interactive video
•
6th - 10th Grade

9 questions
FOREST Community of Caring
Lesson
•
1st - 5th Grade

10 questions
Exploring Veterans Day: Facts and Celebrations for Kids
Interactive video
•
6th - 10th Grade

19 questions
Veterans Day
Quiz
•
5th Grade

14 questions
General Technology Use Quiz
Quiz
•
8th Grade

25 questions
Multiplication Facts
Quiz
•
5th Grade

15 questions
Circuits, Light Energy, and Forces
Quiz
•
5th Grade

19 questions
Thanksgiving Trivia
Quiz
•
6th Grade
Discover more resources for Science

20 questions
Physical and Chemical Changes
Quiz
•
8th Grade

10 questions
Exploring Newton's Laws of Motion
Interactive video
•
6th - 10th Grade

20 questions
Balanced and Unbalanced Forces
Quiz
•
6th - 8th Grade

20 questions
Galaxies
Quiz
•
8th Grade

22 questions
Plate Tectonics
Lesson
•
6th - 8th Grade

10 questions
Unit 2: LS.Bio.1.5-LS.Bio.2.2 Power Vocab
Quiz
•
9th - 12th Grade

9 questions
Conduction, Convection, and Radiation
Lesson
•
6th - 8th Grade

20 questions
Life Cycle of a Star
Quiz
•
8th Grade


