Ratio Tables and Graphs
Authored by Jamie Espinal
Mathematics
6th - 7th Grade
CCSS covered
Used 412+ times

AI Actions
Add similar questions
Adjust reading levels
Convert to real-world scenario
Translate activity
More...
Content View
Student View
25 questions
Show all answers
1.
MULTIPLE CHOICE QUESTION
1 min • 1 pt

If the x-axis represented hours and y-axis represented time, at what hour were the two climbers at the same location?
0
1
2
4
Tags
CCSS.8.EE.C.8C
2.
MULTIPLE CHOICE QUESTION
1 min • 1 pt

What is the ratio of cats to dogs in the table shown in simplest form?
10:12
2:3
1:4
5:6
Tags
CCSS.6.RP.A.1
CCSS.6.RP.A.2
3.
MULTIPLE CHOICE QUESTION
1 min • 1 pt

If there were 21 cars, how many trucks would there be?
28
32
36
24
Tags
CCSS.7.RP.A.2B
4.
MULTIPLE CHOICE QUESTION
1 min • 1 pt
What is the ratio of the line graph shown?
4:1
2:1
3:2
8:1
Tags
CCSS.8.EE.B.5
5.
MULTIPLE CHOICE QUESTION
20 sec • 1 pt

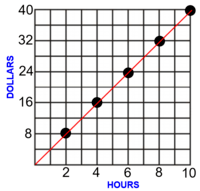
Which of the following statements can be used to create the graph shown?
For every 5 hours of work you get $6
For every 24 hours of work you get $10
For every 36 hours of work you get $50
For every 6 hours of work you get $5
Tags
CCSS.8.EE.B.5
6.
MULTIPLE CHOICE QUESTION
1 min • 1 pt

Using the table shown, how much would it cost to get 1 toy?
$1
$2
$16
$4
Tags
CCSS.6.RP.A.1
CCSS.6.RP.A.2
CCSS.6.RP.A.3
7.
MULTIPLE CHOICE QUESTION
1 min • 1 pt

Using the given table, if there are 20 sandals, how many shoes would there be?
10
40
5
30
Tags
CCSS.5.OA.B.3


Access all questions and much more by creating a free account
Create resources
Host any resource
Get auto-graded reports
Continue with Google

Continue with Email
Continue with Classlink
Continue with Clever
or continue with
Microsoft
%20(1).png)
Apple
Others
Already have an account?
