
Remediation 6.1 CFA Comparing Statistical Measures
Presentation
•
Mathematics
•
11th Grade
•
Practice Problem
•
Easy
•
CCSS
6.NS.B.3, 6.SP.B.5D, 6.SP.B.5C
+1
Standards-aligned

Amanda Wood
Used 6+ times
FREE Resource
7 Slides • 11 Questions
1

2

3
Multiple Choice

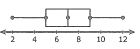
Which of the following best describes the shape of the distribution?
4
Multiple Choice

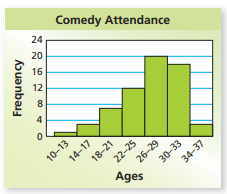
Describe the shape of the distribution.
5
Multiple Choice

Describe the shape of the distribution.
6
Multiple Choice

How is the graph distributed?
7
Multiple Choice

How is the graph distributed?
8
9

10

11

12

13
Multiple Choice
14
Multiple Choice
15
Multiple Choice
16
Multiple Choice
17
Multiple Choice
Given that the data is symmetric, which pair of measures should be used to represent the data?
18
Multiple Choice
Which measure of spread should be used to describe the distribution?
Show answer
Auto Play
Slide 1 / 18
SLIDE
